Charts - Astrologer`s work tool. Galaxy.Charts astrological program
 Charts (Galaxy.Charts) is the main tool of modern astrology which allows to create both single and dual astrological charts, as well as multi-charts to perform different kinds of tasks from the rectification and analysis to the prognosis of the events on the astrological houses themes. Charts works with the following types of charts: natal, transit, average, composite, horary, and synastry by means of different kinds of astrological instruments: transits, directions, progressions and returns. Single and double charts are created in 3 coordinate systems: ecliptic, horizontal and 1- and 2 equatorial. For creating charts 14 major house systems are used. Positions of celestial objects (stars, planets, asteroids, fictitious planets and points, Arabian parts and stars) are calculated using Swiss Ephemeris.
The main feature and the fundamental difference between Galaxy astrological programs from other programs on the market is use of charts list (events) and astrological instruments that greatly simplifies and speeds up the work of a modern astrologer. Many innovative solutions in the programs included in Galaxy - Astrological Tools astrological software package allow to save the time for the primary analysis of different types of charts and enable the astrologer to focus on the end result.
Additional information about program
- Functionality of program
- Additional functions of the module "Charts++ - Advanced Features Module
- ChartDecor - Chart decoration module
- ChartConductor - module for preparing and transmitting requests to AI ("Prompt-conductor")
- Screenshots and brief description
- System requirements to program
- Load (download) resources
- Frequently asked Questions
- Project participants depending on personal contribution
- Program cost
- Prices
Functionality of program
| Operation mode |
|
| Astrological Tools |
|
| Work with charts |
|
| Supported planes |
|
| Supported house systems | 24 house systems, including - 14 of the most common and 10 modern |
| Zodiac system | Tropical |
| Work with aspects |
it works with all aspects, including
|
| Work with objects |
|
| Support schemes for including objects in charts |
|
| Loading and saving charts | work with unlimited number of databases and unlimited structure of bank |
| Support time points | unlimited number of time points (module Charts++) |
| Support dynamic of chart |
|
| Calculation of time correction | Considering alternative recourses |
| Directory of populated places coordinates | More than 16 ths populated places (in Locator program) around the globe |
| Protect of charts | Chart data protection against accidental change |
| Additional |
|
Additional functions of the module "Charts++ - Advanced Features Module"
- multi-modes ("One event - many instruments", "One instrument - many events") - allows you to work simultaneously with many charts and tools. You can display up to 9 charts at the same time. Different modes are used both in rectification, and in prognostication;
- Freestyle mode - allows you to simultaneously display both single and double charts with different systems of houses and planes for an overall assessment;
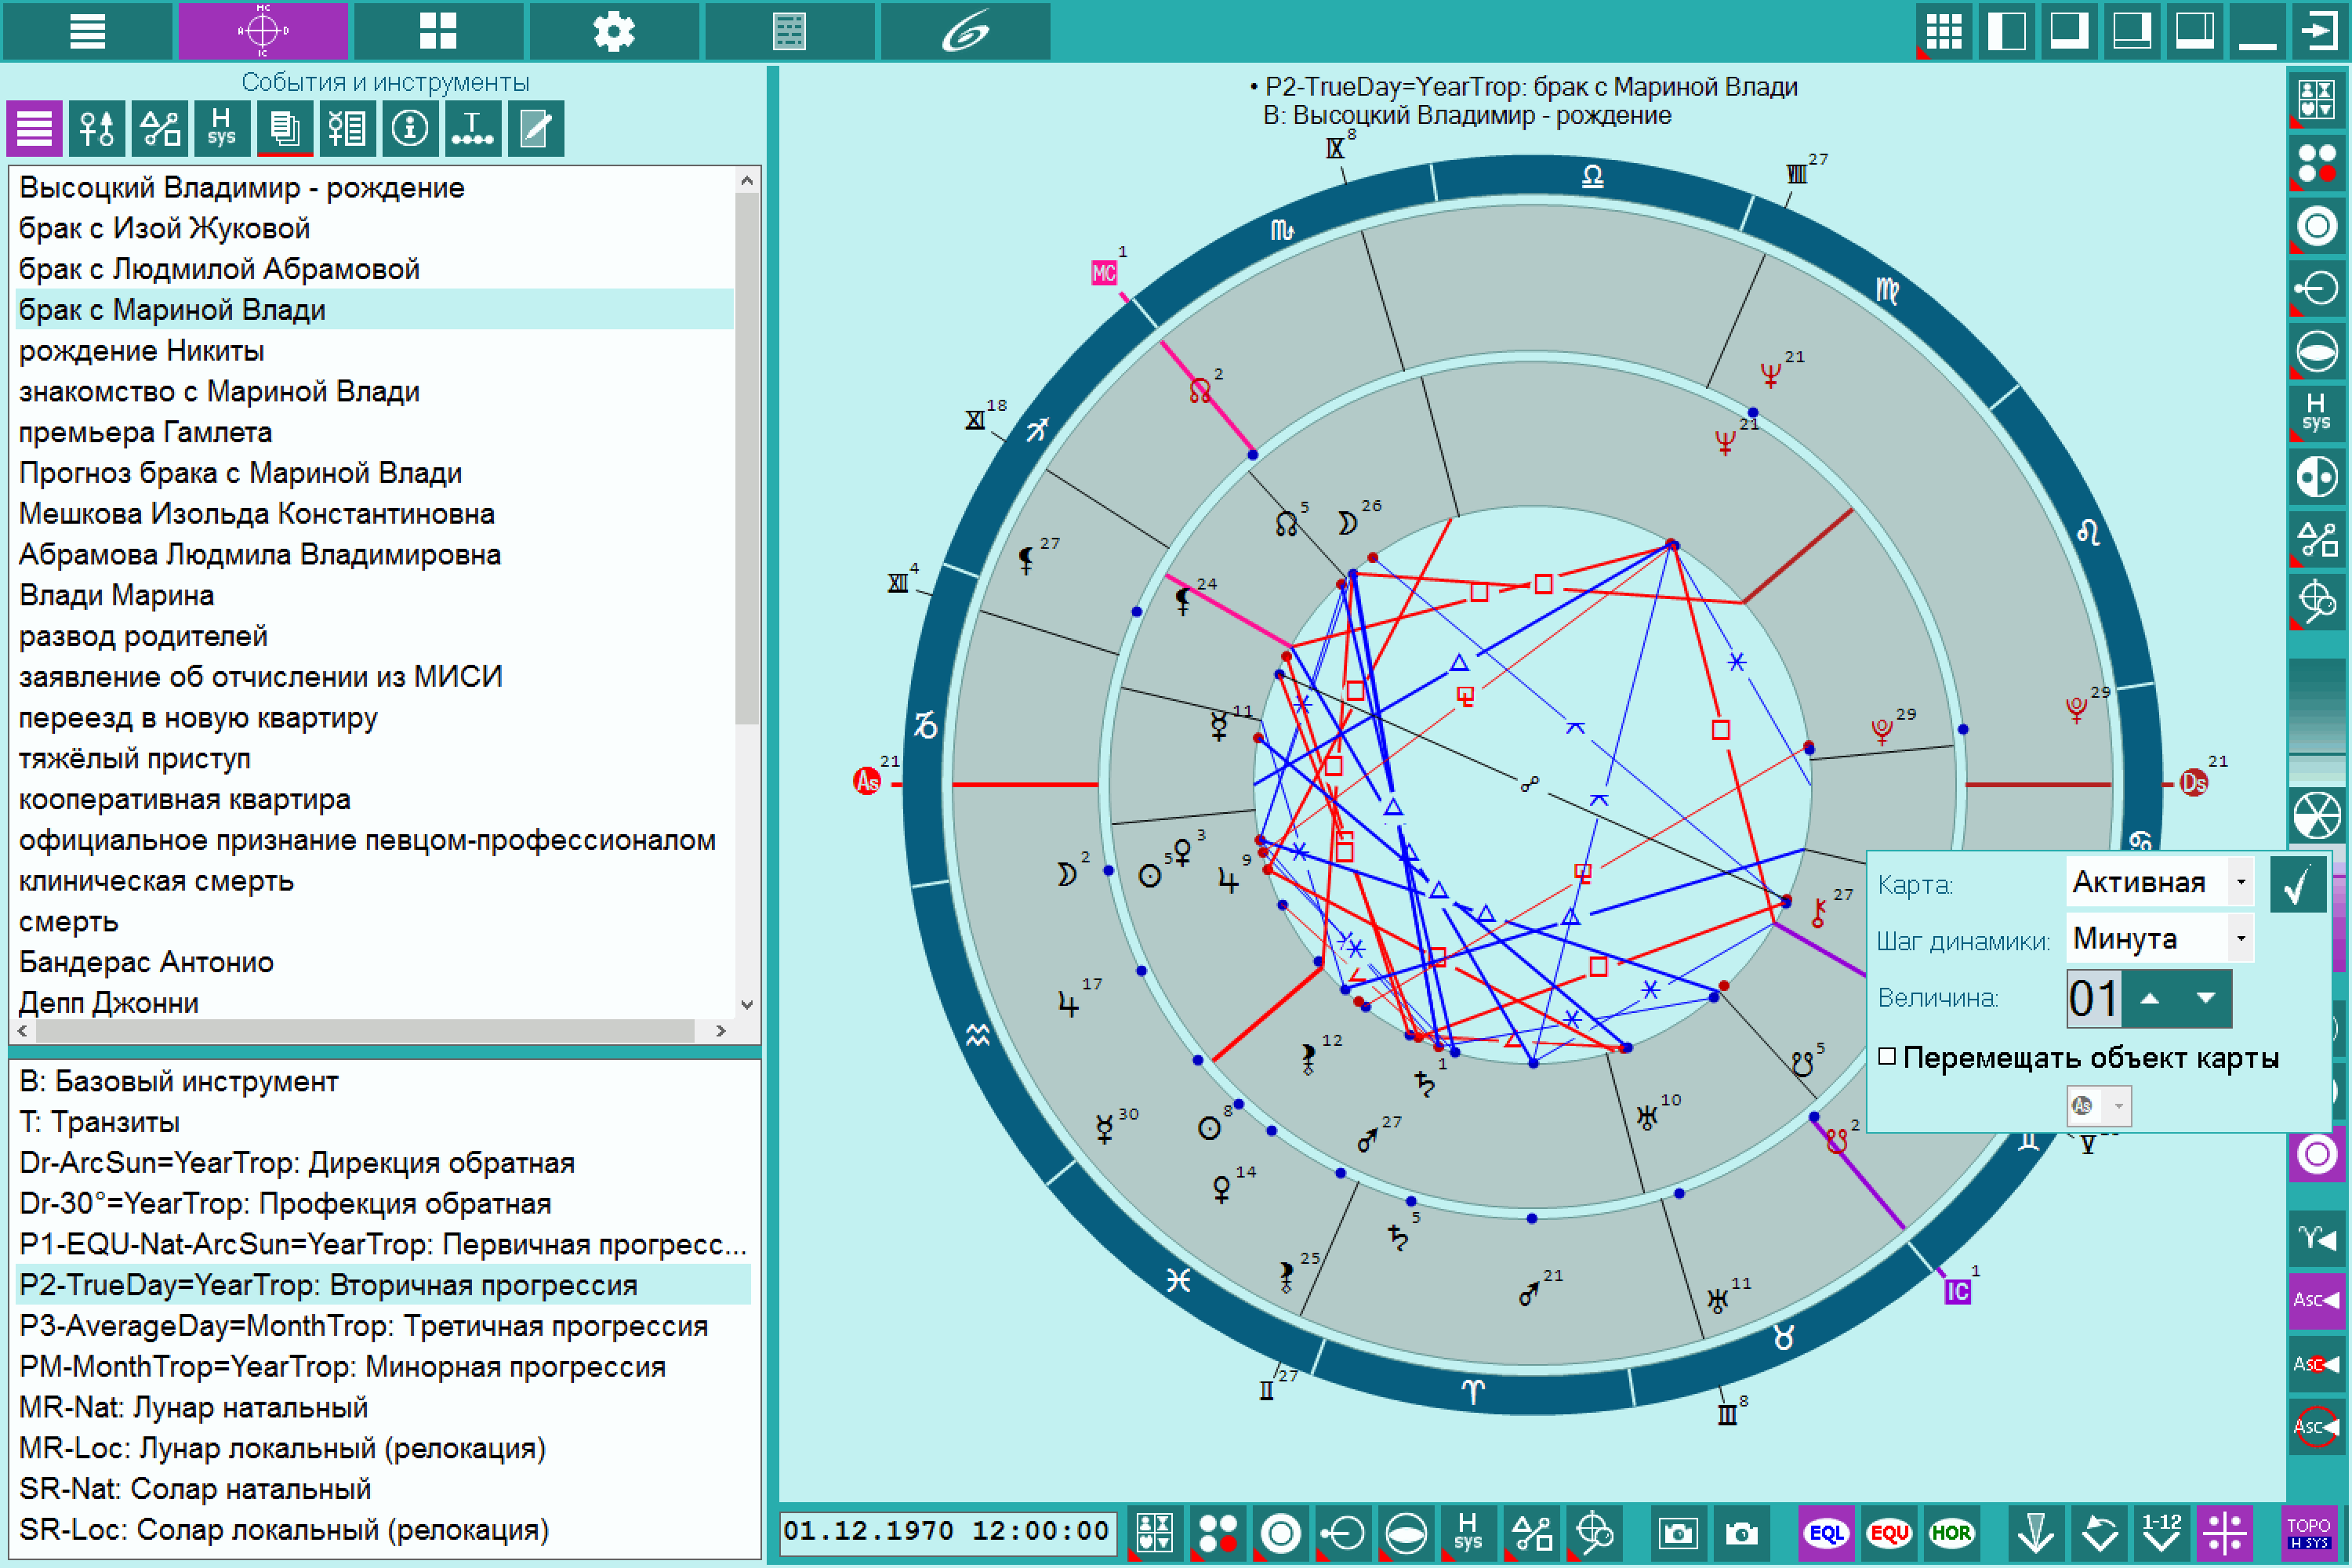
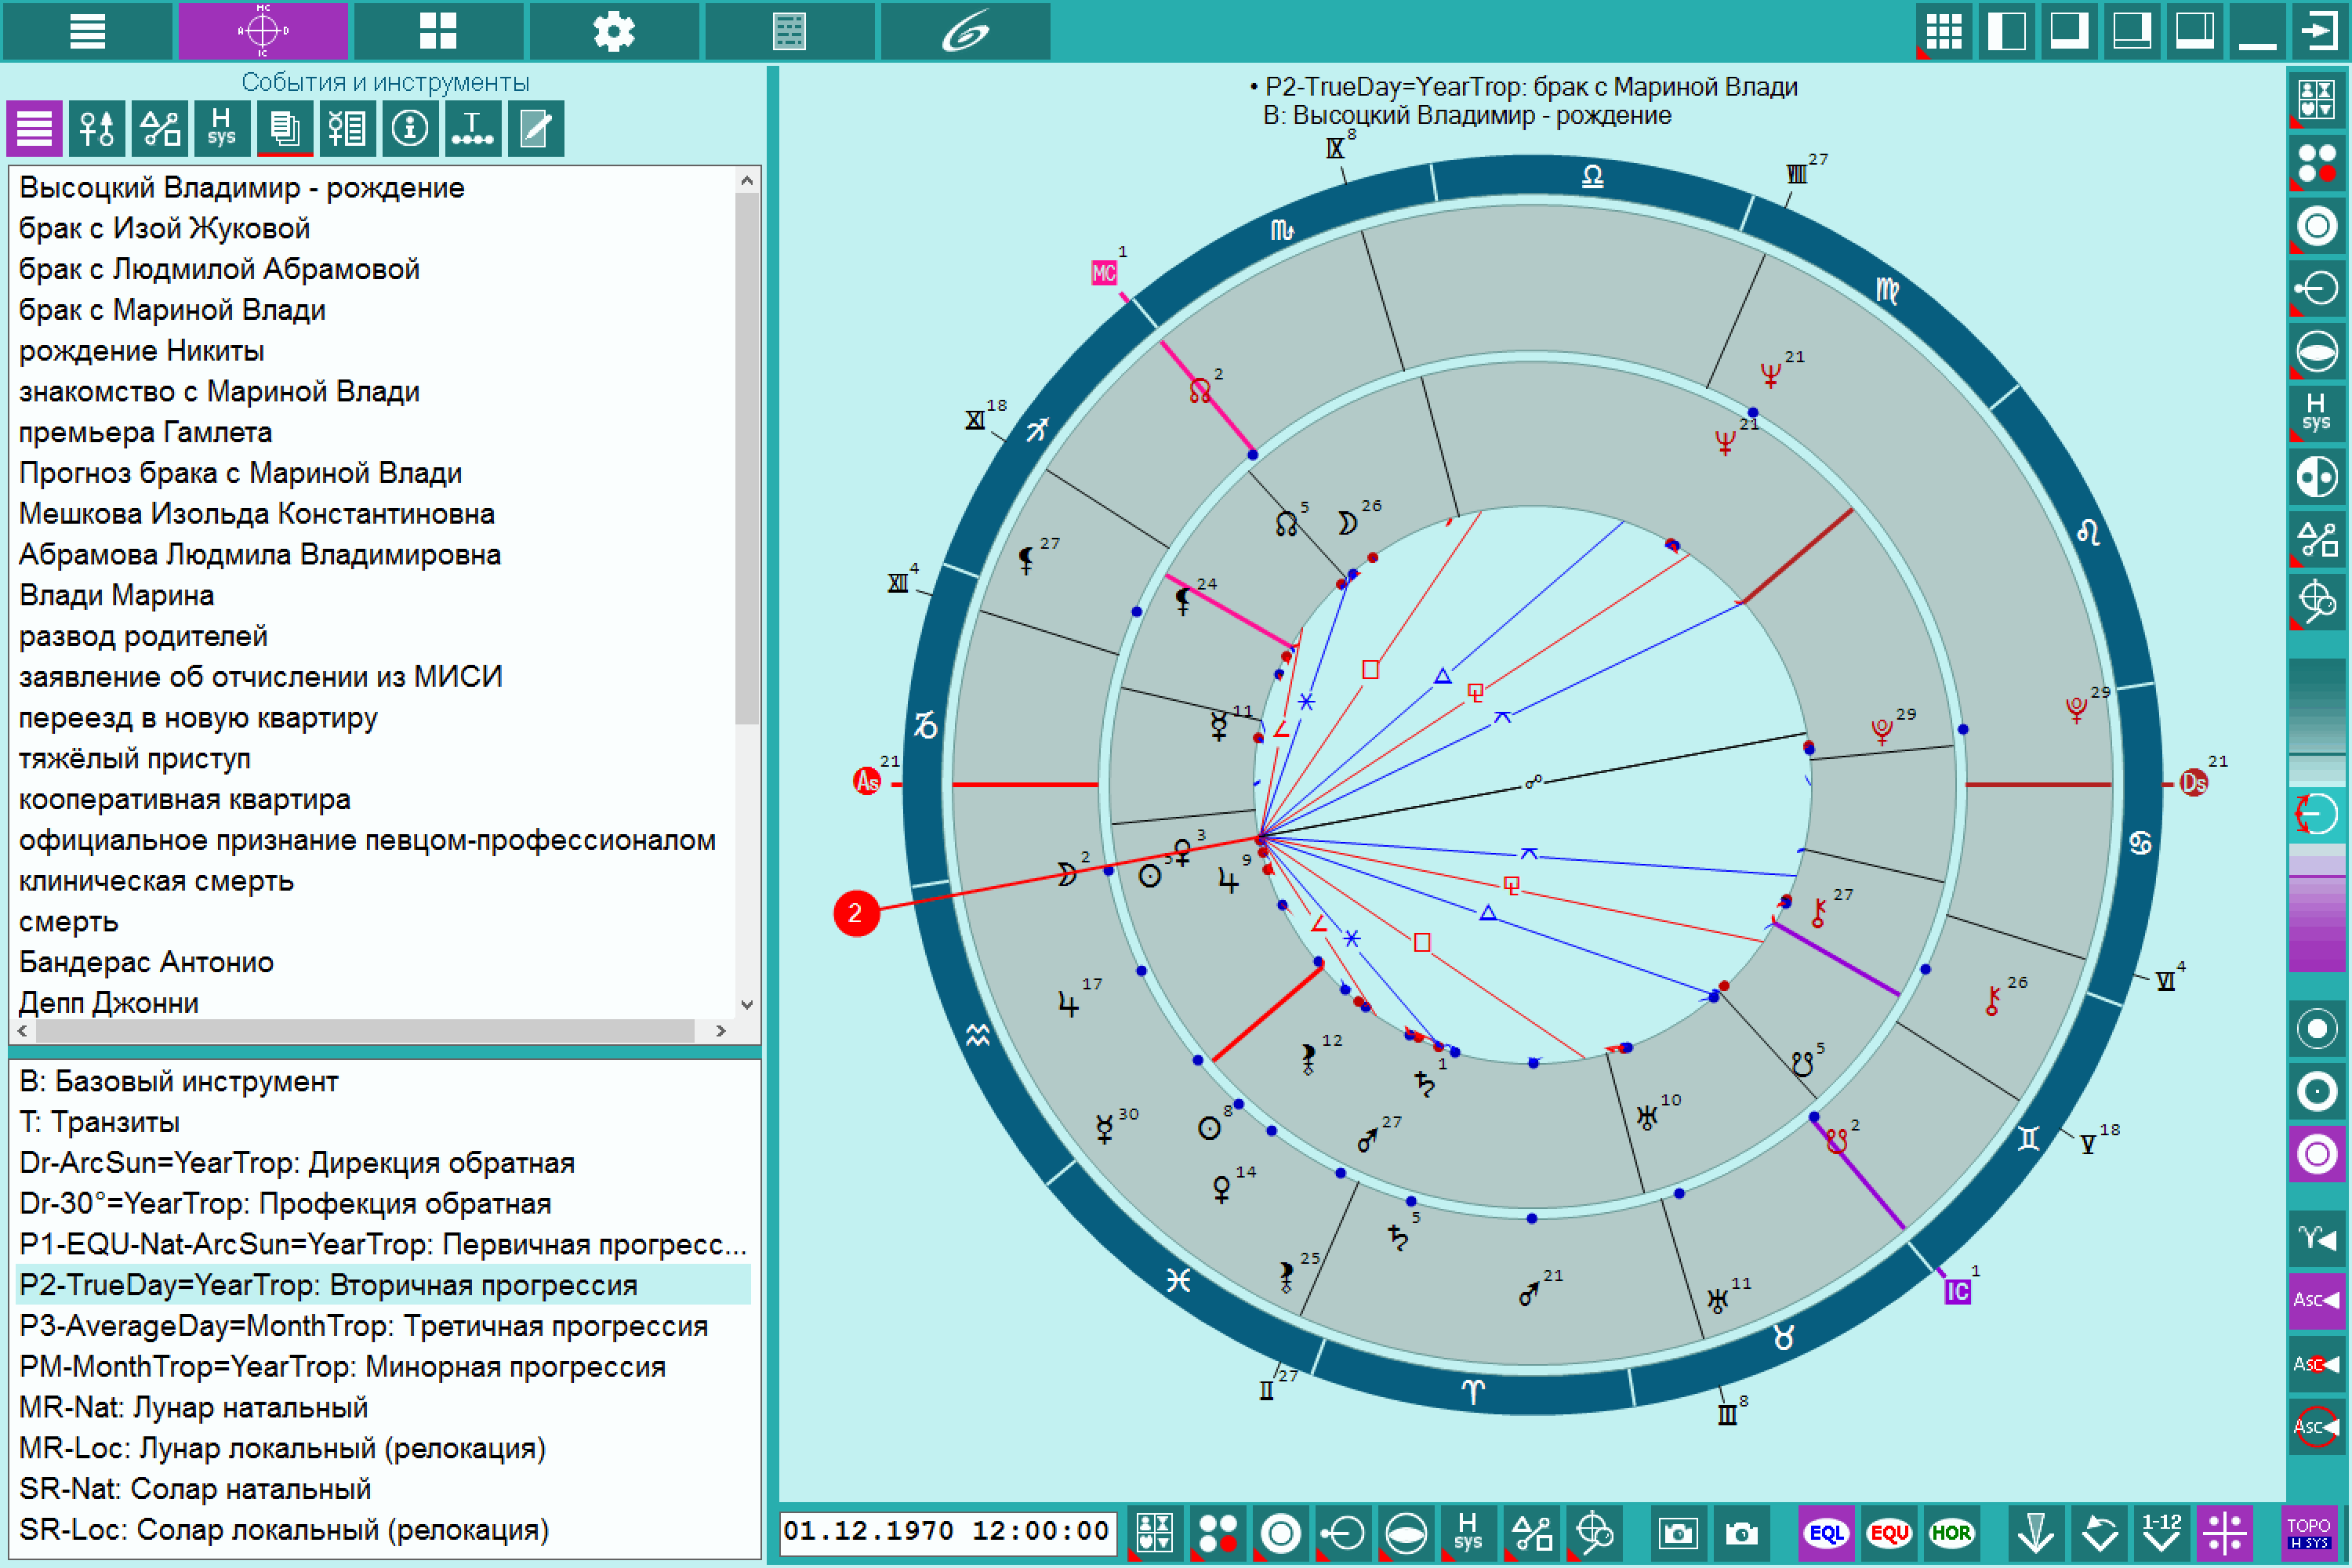
- tool "Chart Dynamics - Move Chart Object" - allows you to quickly, by moving the mouse over an object on the chart, find various kinds of phenomena from the ingression of objects to their aspects. The search can be performed with any astrological tools;
- Tool "Select chart object" - allows you to display on the chart only those chart objects that the astrologer has specified. This allows you to focus attention only on selected objects;
- tool - "Change chart time for a period" - allows you to quickly change the chart time within a given framework and quickly return to the original time. This can be used in rectification and prognosis;
- Incremental selection of charts and astrological tools tool - allows you to quickly navigate through charts or tools without opening a page with lists of charts and astrological tools. Or duplicate the charts and tools page when displaying another tab of the multifunctional panel;
- "Local space chart" - allows you to display a local space chart for the selected chart;
- "Time points" mechanism - allows you to work with the built-in time points mechanism to quickly change and restore the date-time of a chart or event;
- type of aspects "Thematic aspects" - allows you to display on the chart only those aspects that are responsible for the topic of the event. In this case, thematic objects are displayed in color, and non-thematic ones - in gray;
- option "Real position of the angular" - allows you to display in the form of reference information next to the chart the real position of the planet in the house near the angular cusps. From-due to failure to take into account the latitude of the object, it often happens that in reality the planet is already in a different house;
- button "Save the full text of the interpretation" - if the module "Natal Chart Analysis" for ChartAnalyzer is purchased, it becomes possible to save the full text of the interpretation of chart objects.
ChartDecor - Chart decoration module
The module is a specialized graphic editor for raster and vector graphics with databases of background images, seals and chart types for decorating astrological charts. Decorating means "decorating" and preparing gift pictures with various astrological types of charts (from rarities to modern ones), tables of aspects, chains of dispositors and thirty-degree indicators. Prepared images are saved in TIFF format, which provides high quality files for subsequent printing on large sheets of paper. See screenshots of the ChartDecor module.
The module comes in two versions:
- basic version (ChartDecor - module). It contains a limited number of background images, stamps and types of cards. A total of about 200 entries (pictures and types of charts);
- extended option (basic option + extended ChartDecor++ data set). It contains a full set of background pictures, stamps and types of chart. In total - more than 2000 records.
Back to top
ChartConductor - module for preparing and transmitting requests to AI ("Prompt-conductor")
The module is designed to create prompt requests and transmit them to artificial intelligence (AI) chatbots to obtain a description of the chart. Those. Using this module, you can prepare a request text for any AI chatbot in order to receive a comprehensive answer (description) of the natal chart with different types of aggregation and details. Those. in the language of astrologers - to synthesize the natal chart. See screenshots of the ChartConductor module.
Using many different options, you can turn on or off certain data components that form the text of the request. Options mean:
- choose the theme of the house description;
- taking into account the objects of the house theme;
- accounting of planets in degrees of signs and parts of houses;
- accounting of rulers in degrees of signs and parts of houses;
- accounting of rulers in the houses of the horoscope;
- taking into account the strength of objects;
- AI interpretation machine;
- etc.
- from the list of modules;
- from the "Interpretation of chart objects" tab of the multifunctional panel.
Screenshots and brief description
To view large pictures, please, mouse click on picture.
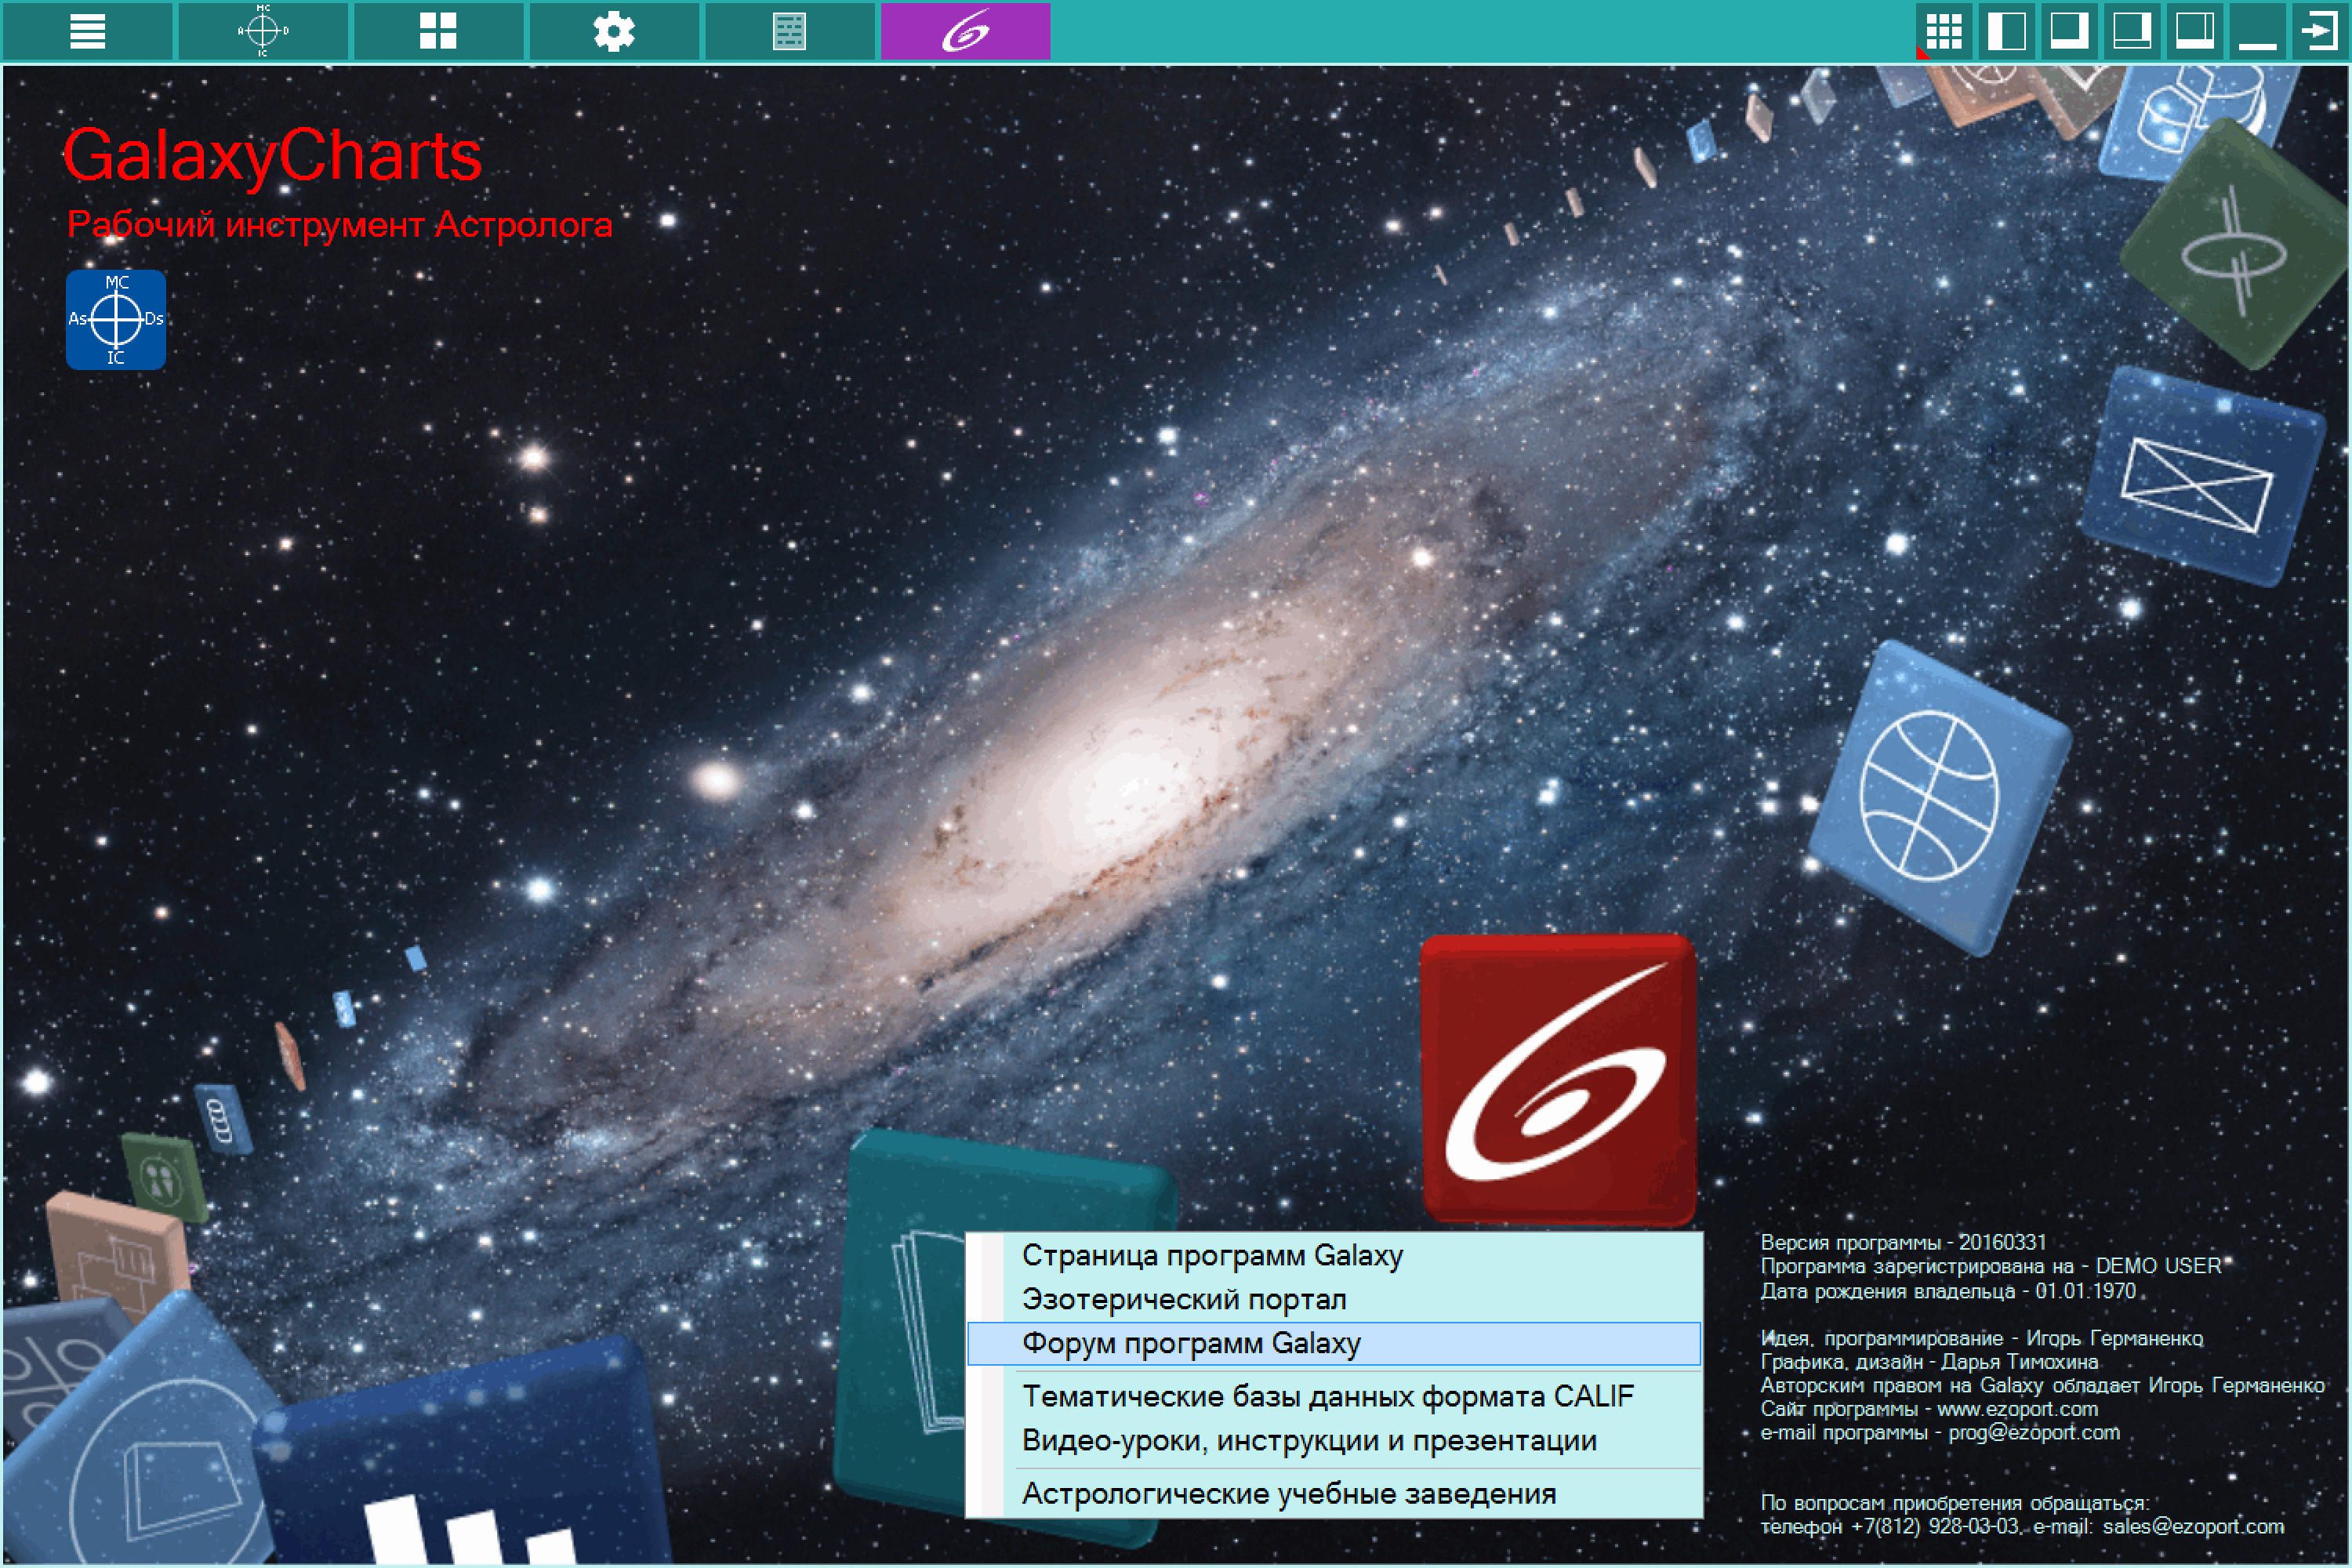 |
Display 'About a program' with information about user and feedback with the developer |
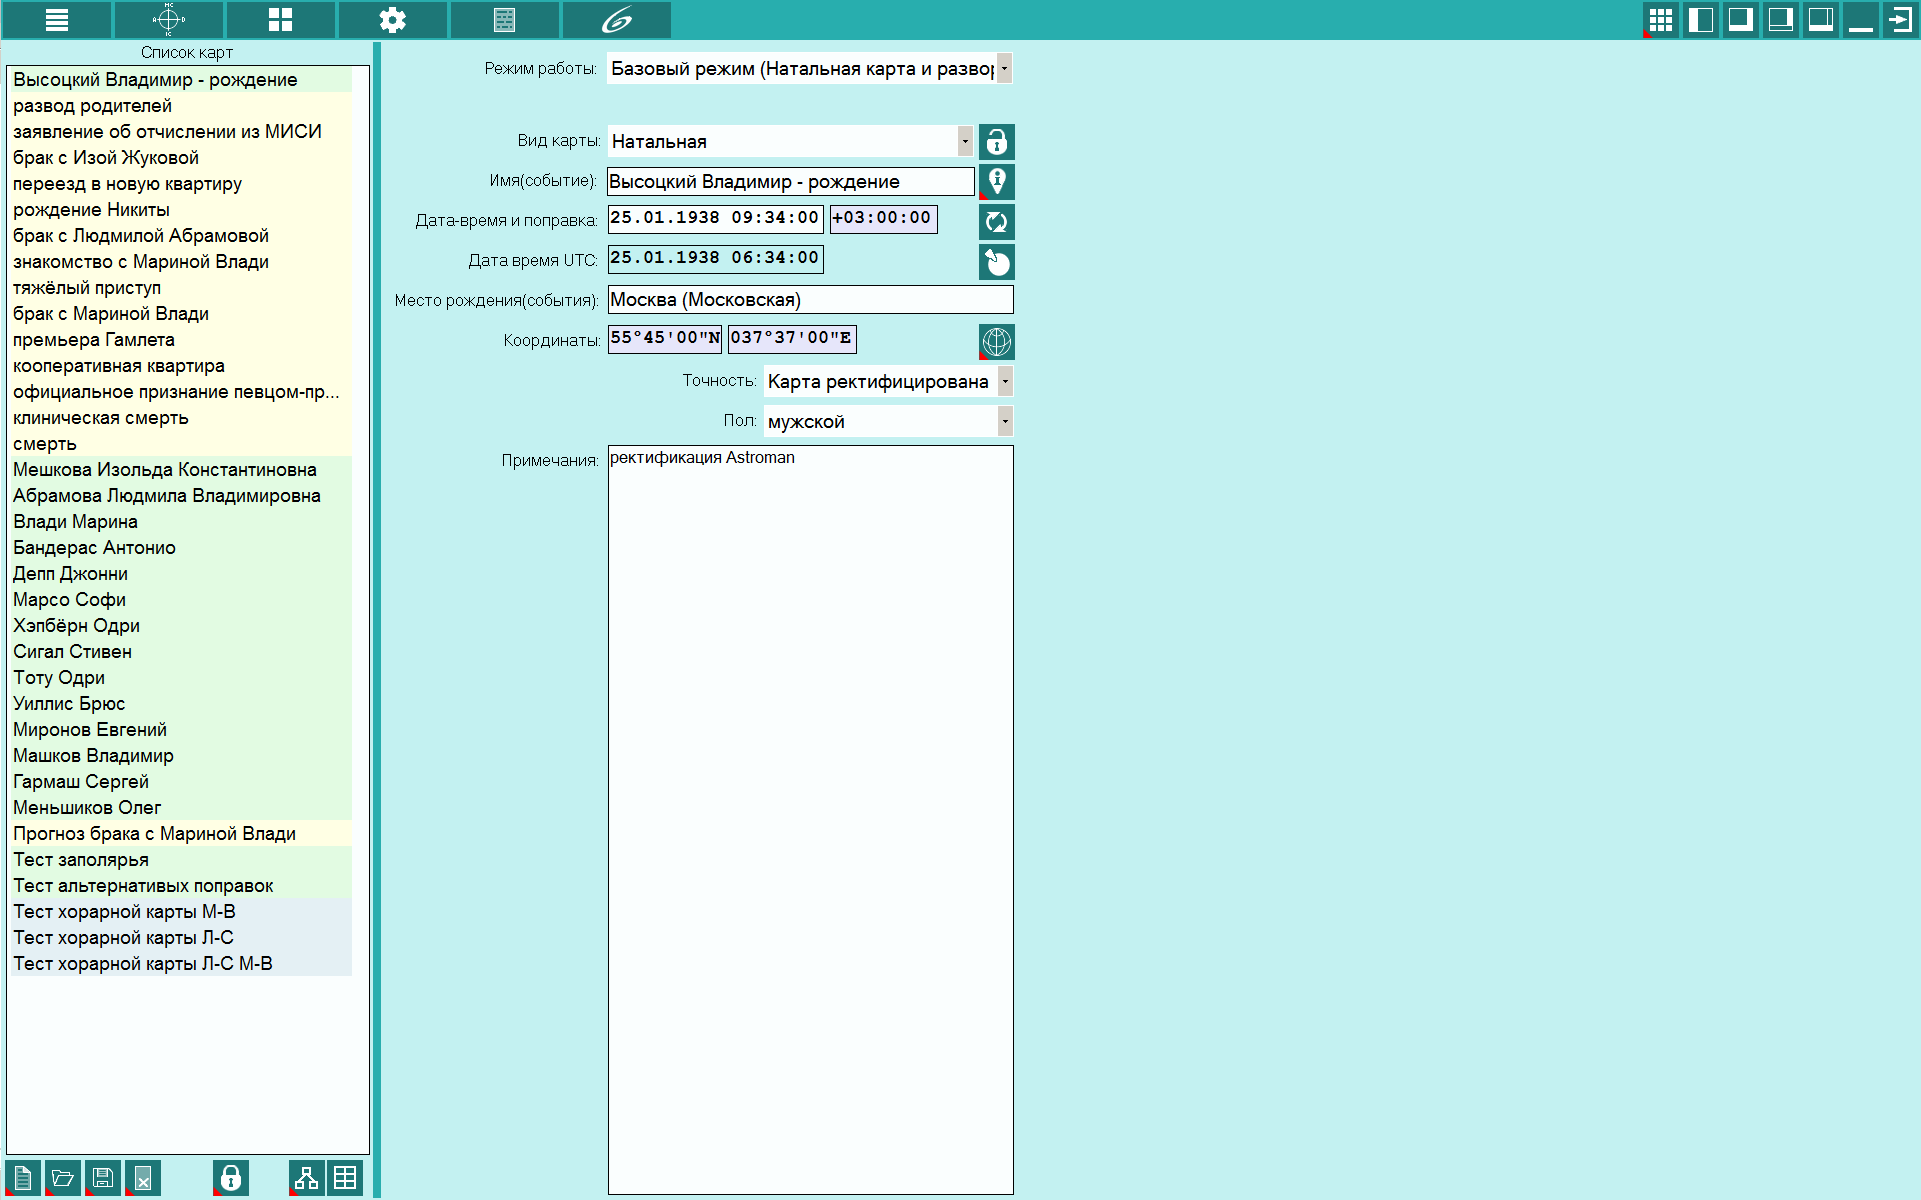 |
Data entry screen for the charts (events). List of charts greatly simplifies data download, selection and generation. It refers not only to current knowledge under the data, but also additional parameters needed for automated operation of astrological programs. Illumination of charts of various types in the list. Charts of different types are displayed in the list of charts in different colors and can have 8 combinations of displaying the name, specified by the background color and tone color. The background color of the chart determines the type of chart:
|
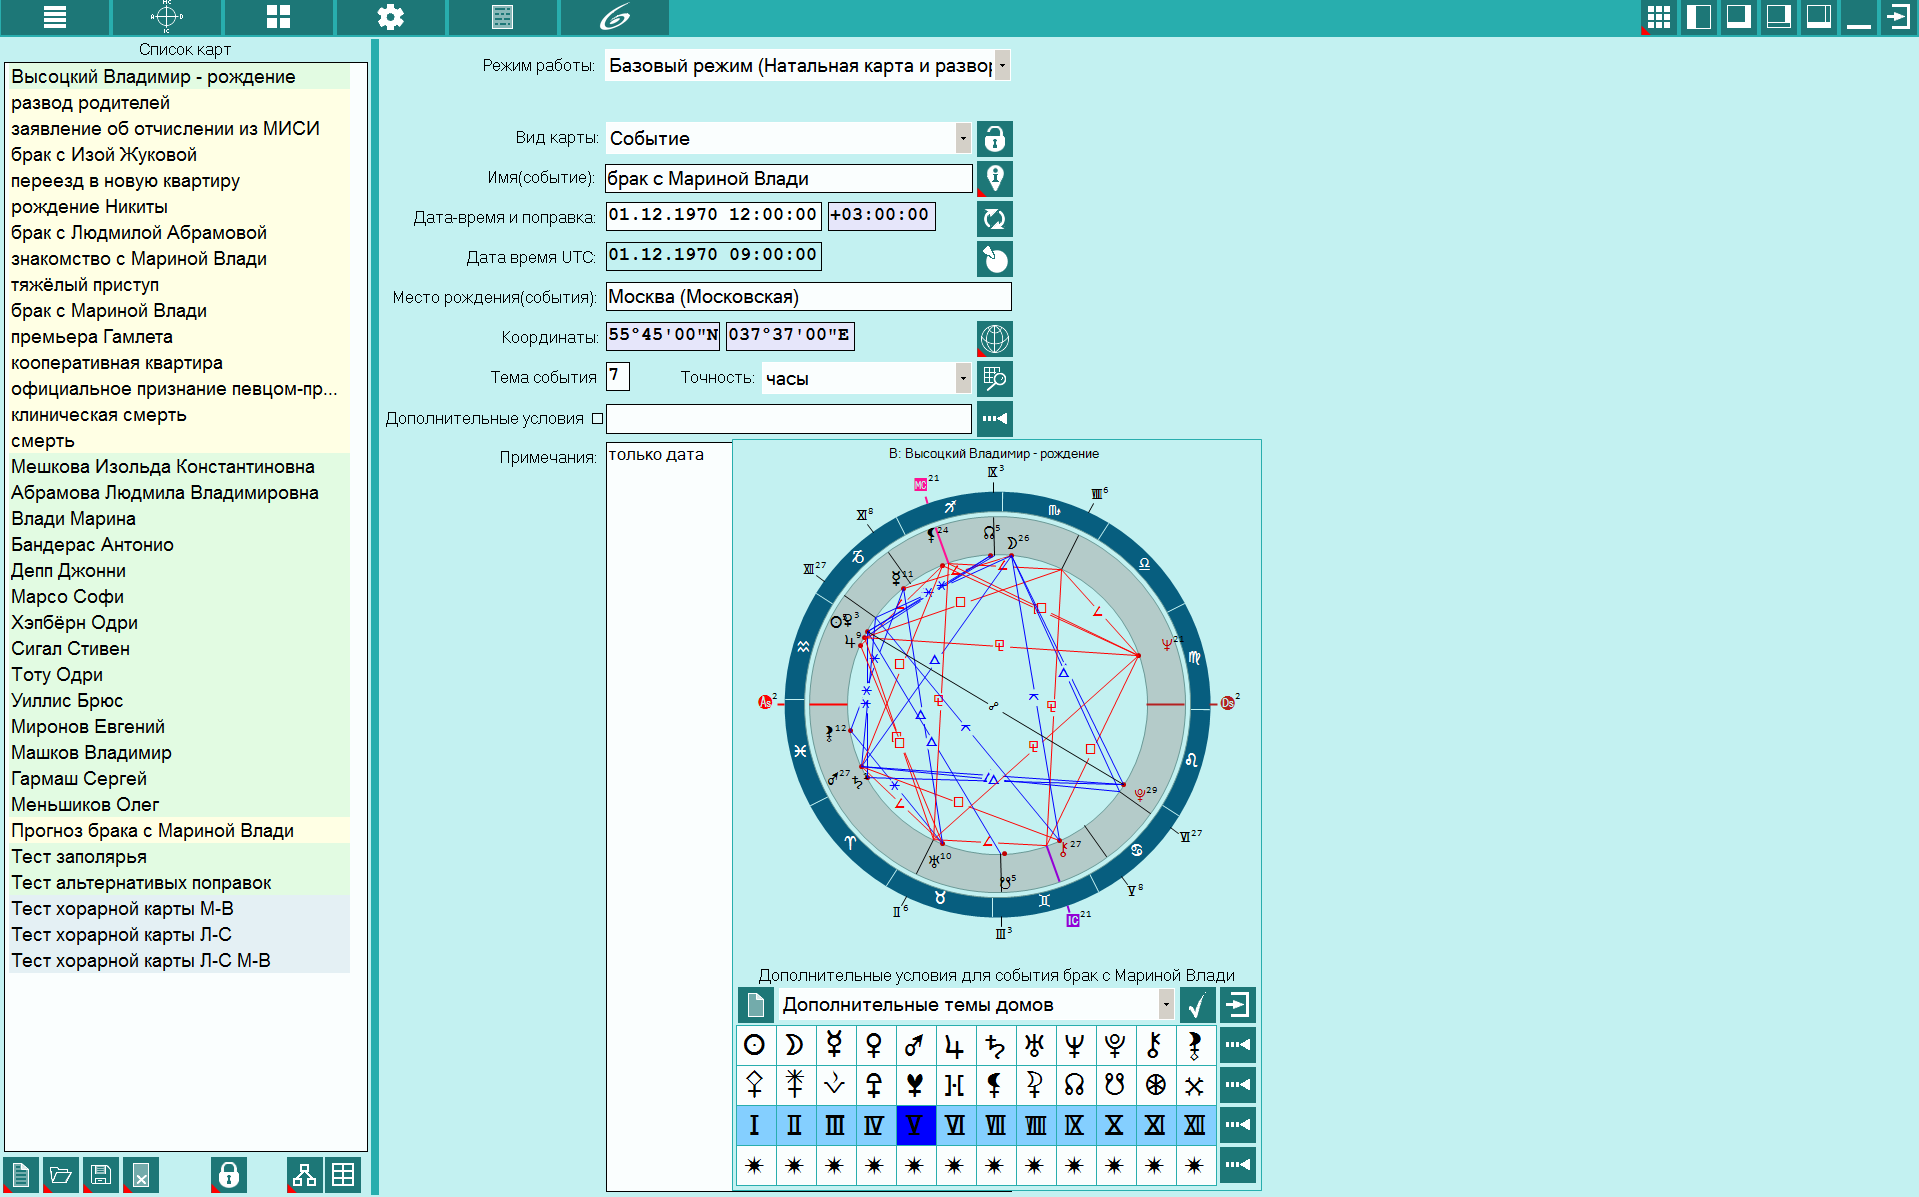 |
Additional features for the event allow for more subtle and accurate use of thematic objects for rectification and prognostics. This mechanism allows you to:
|
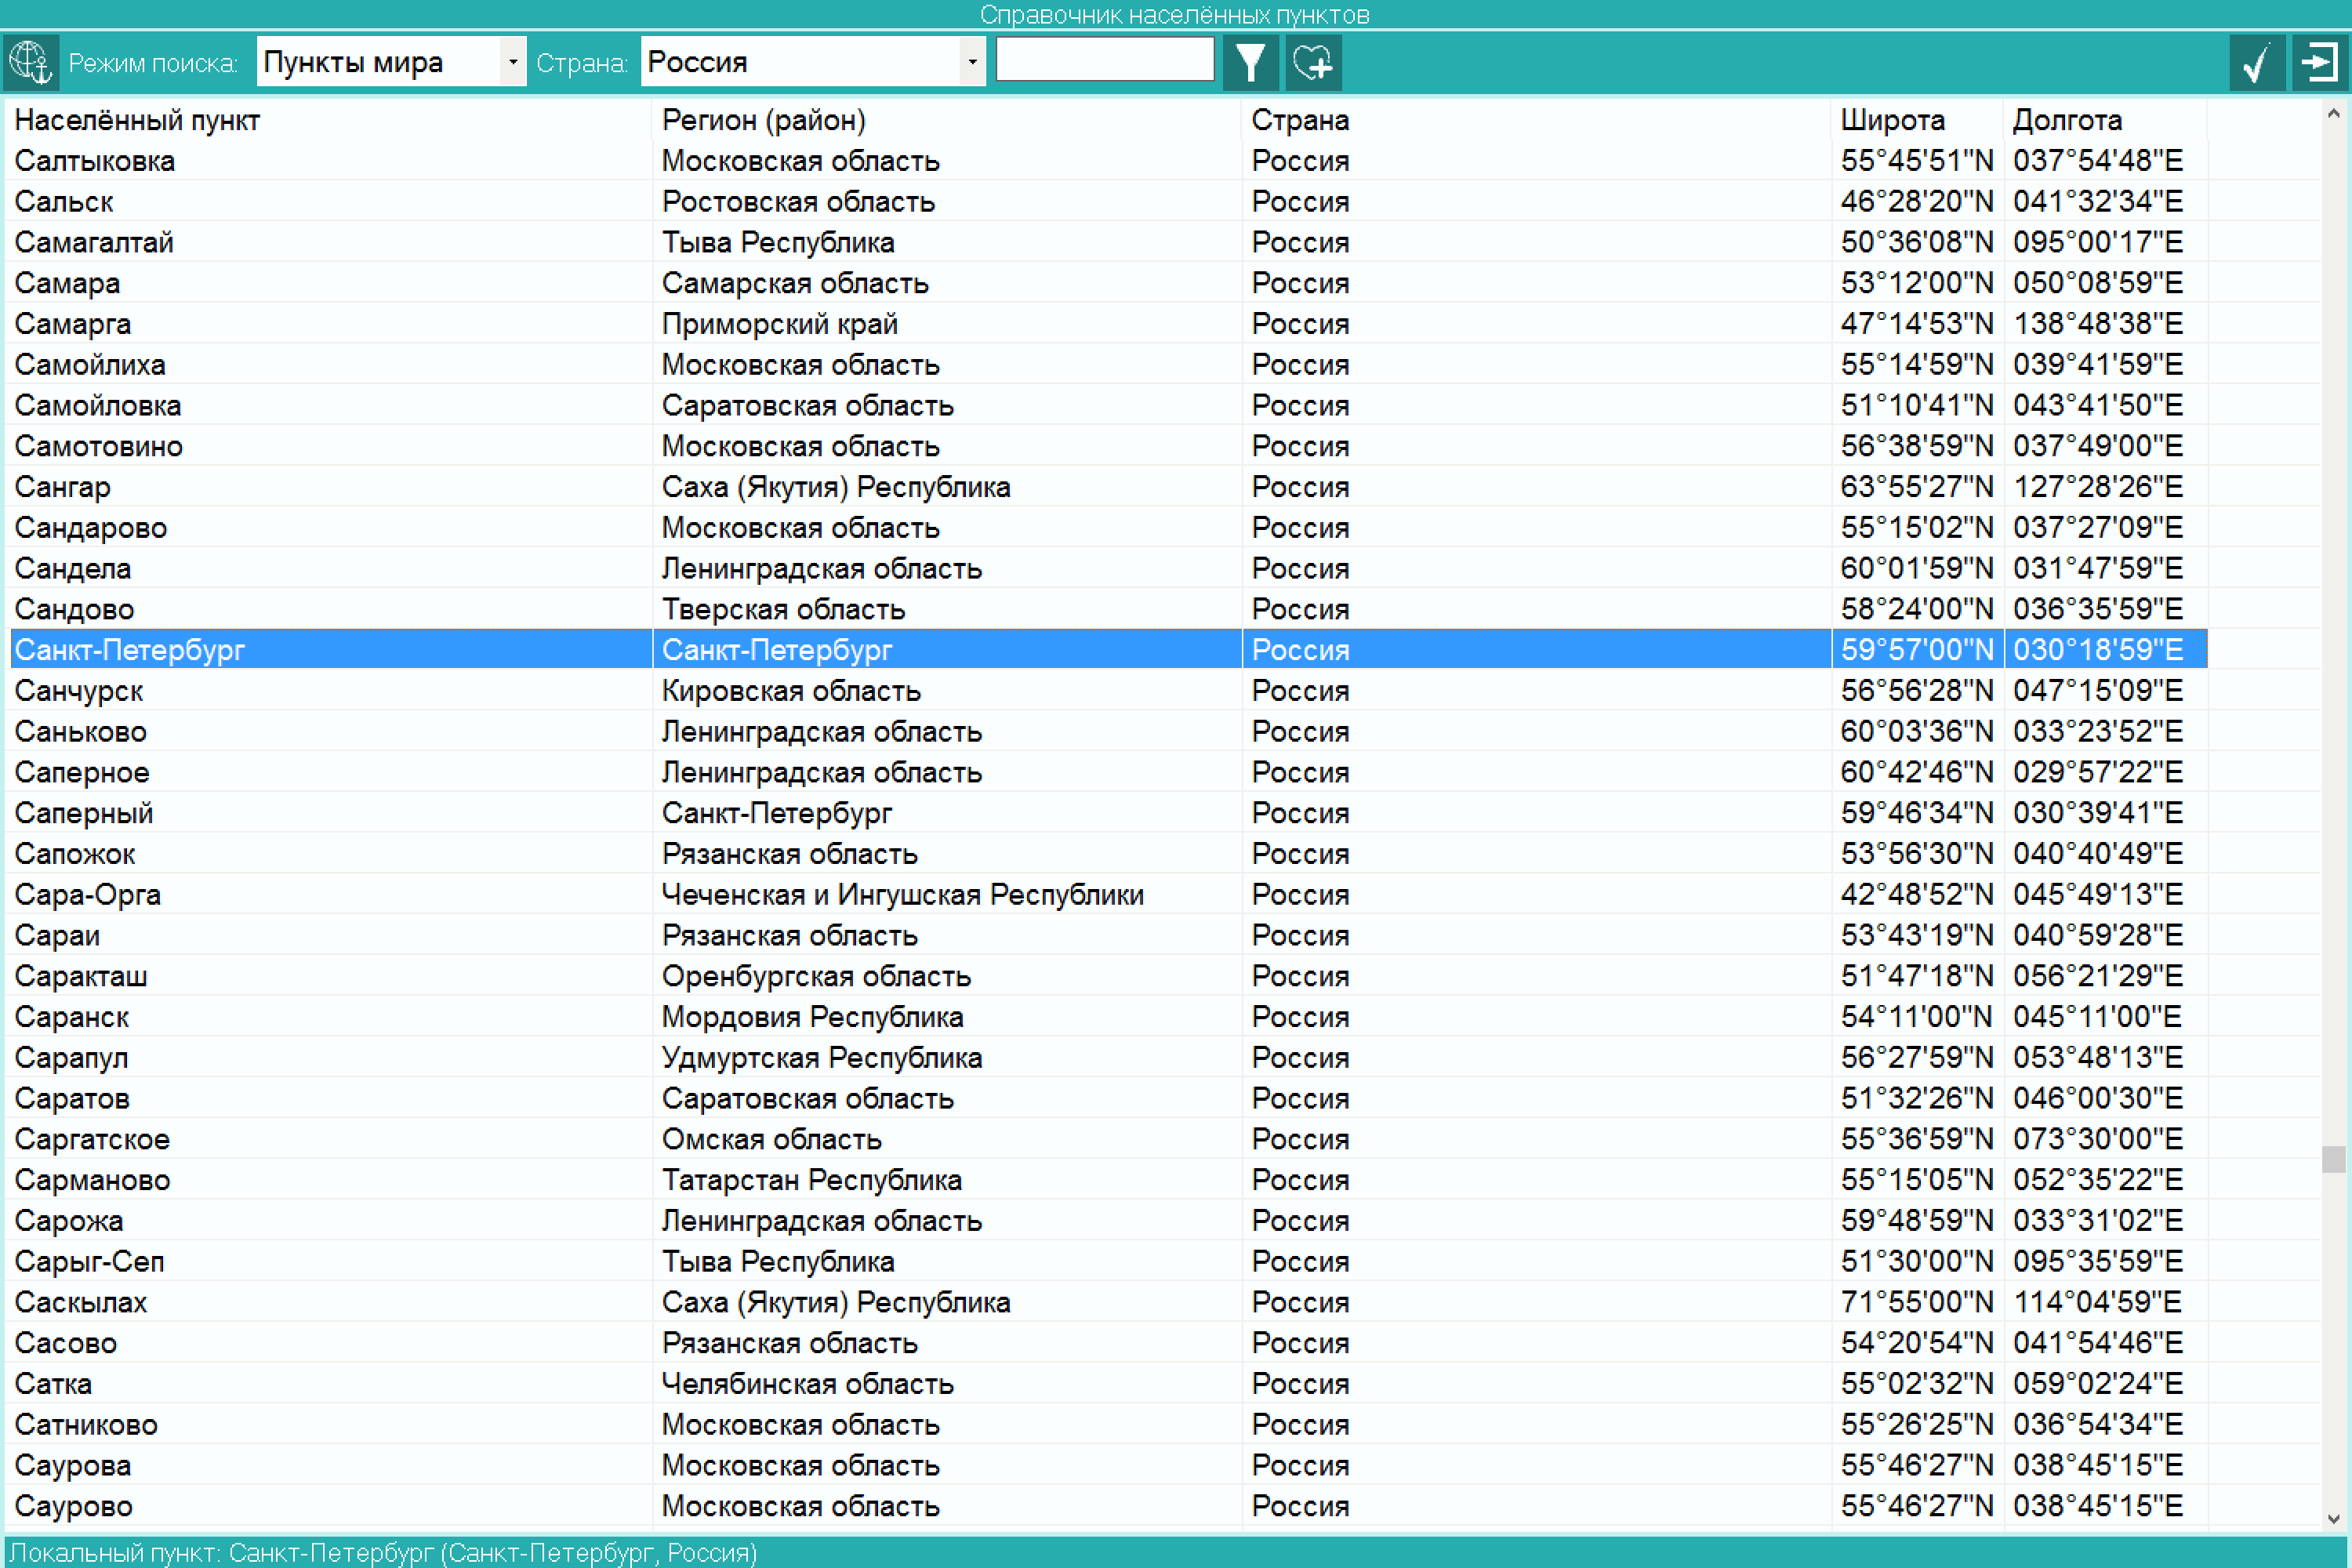 |
City directory. In addition to Locator astrology program which works with more than three million of cities all over the world this directory contains the most commonly used settlements. The search is not only by first letters of name, but by entering the phrase in the name, which significantly increases the chances of a positive result. Frequently used settlements can be added to the favorites. Thus it speeds up work on a search |
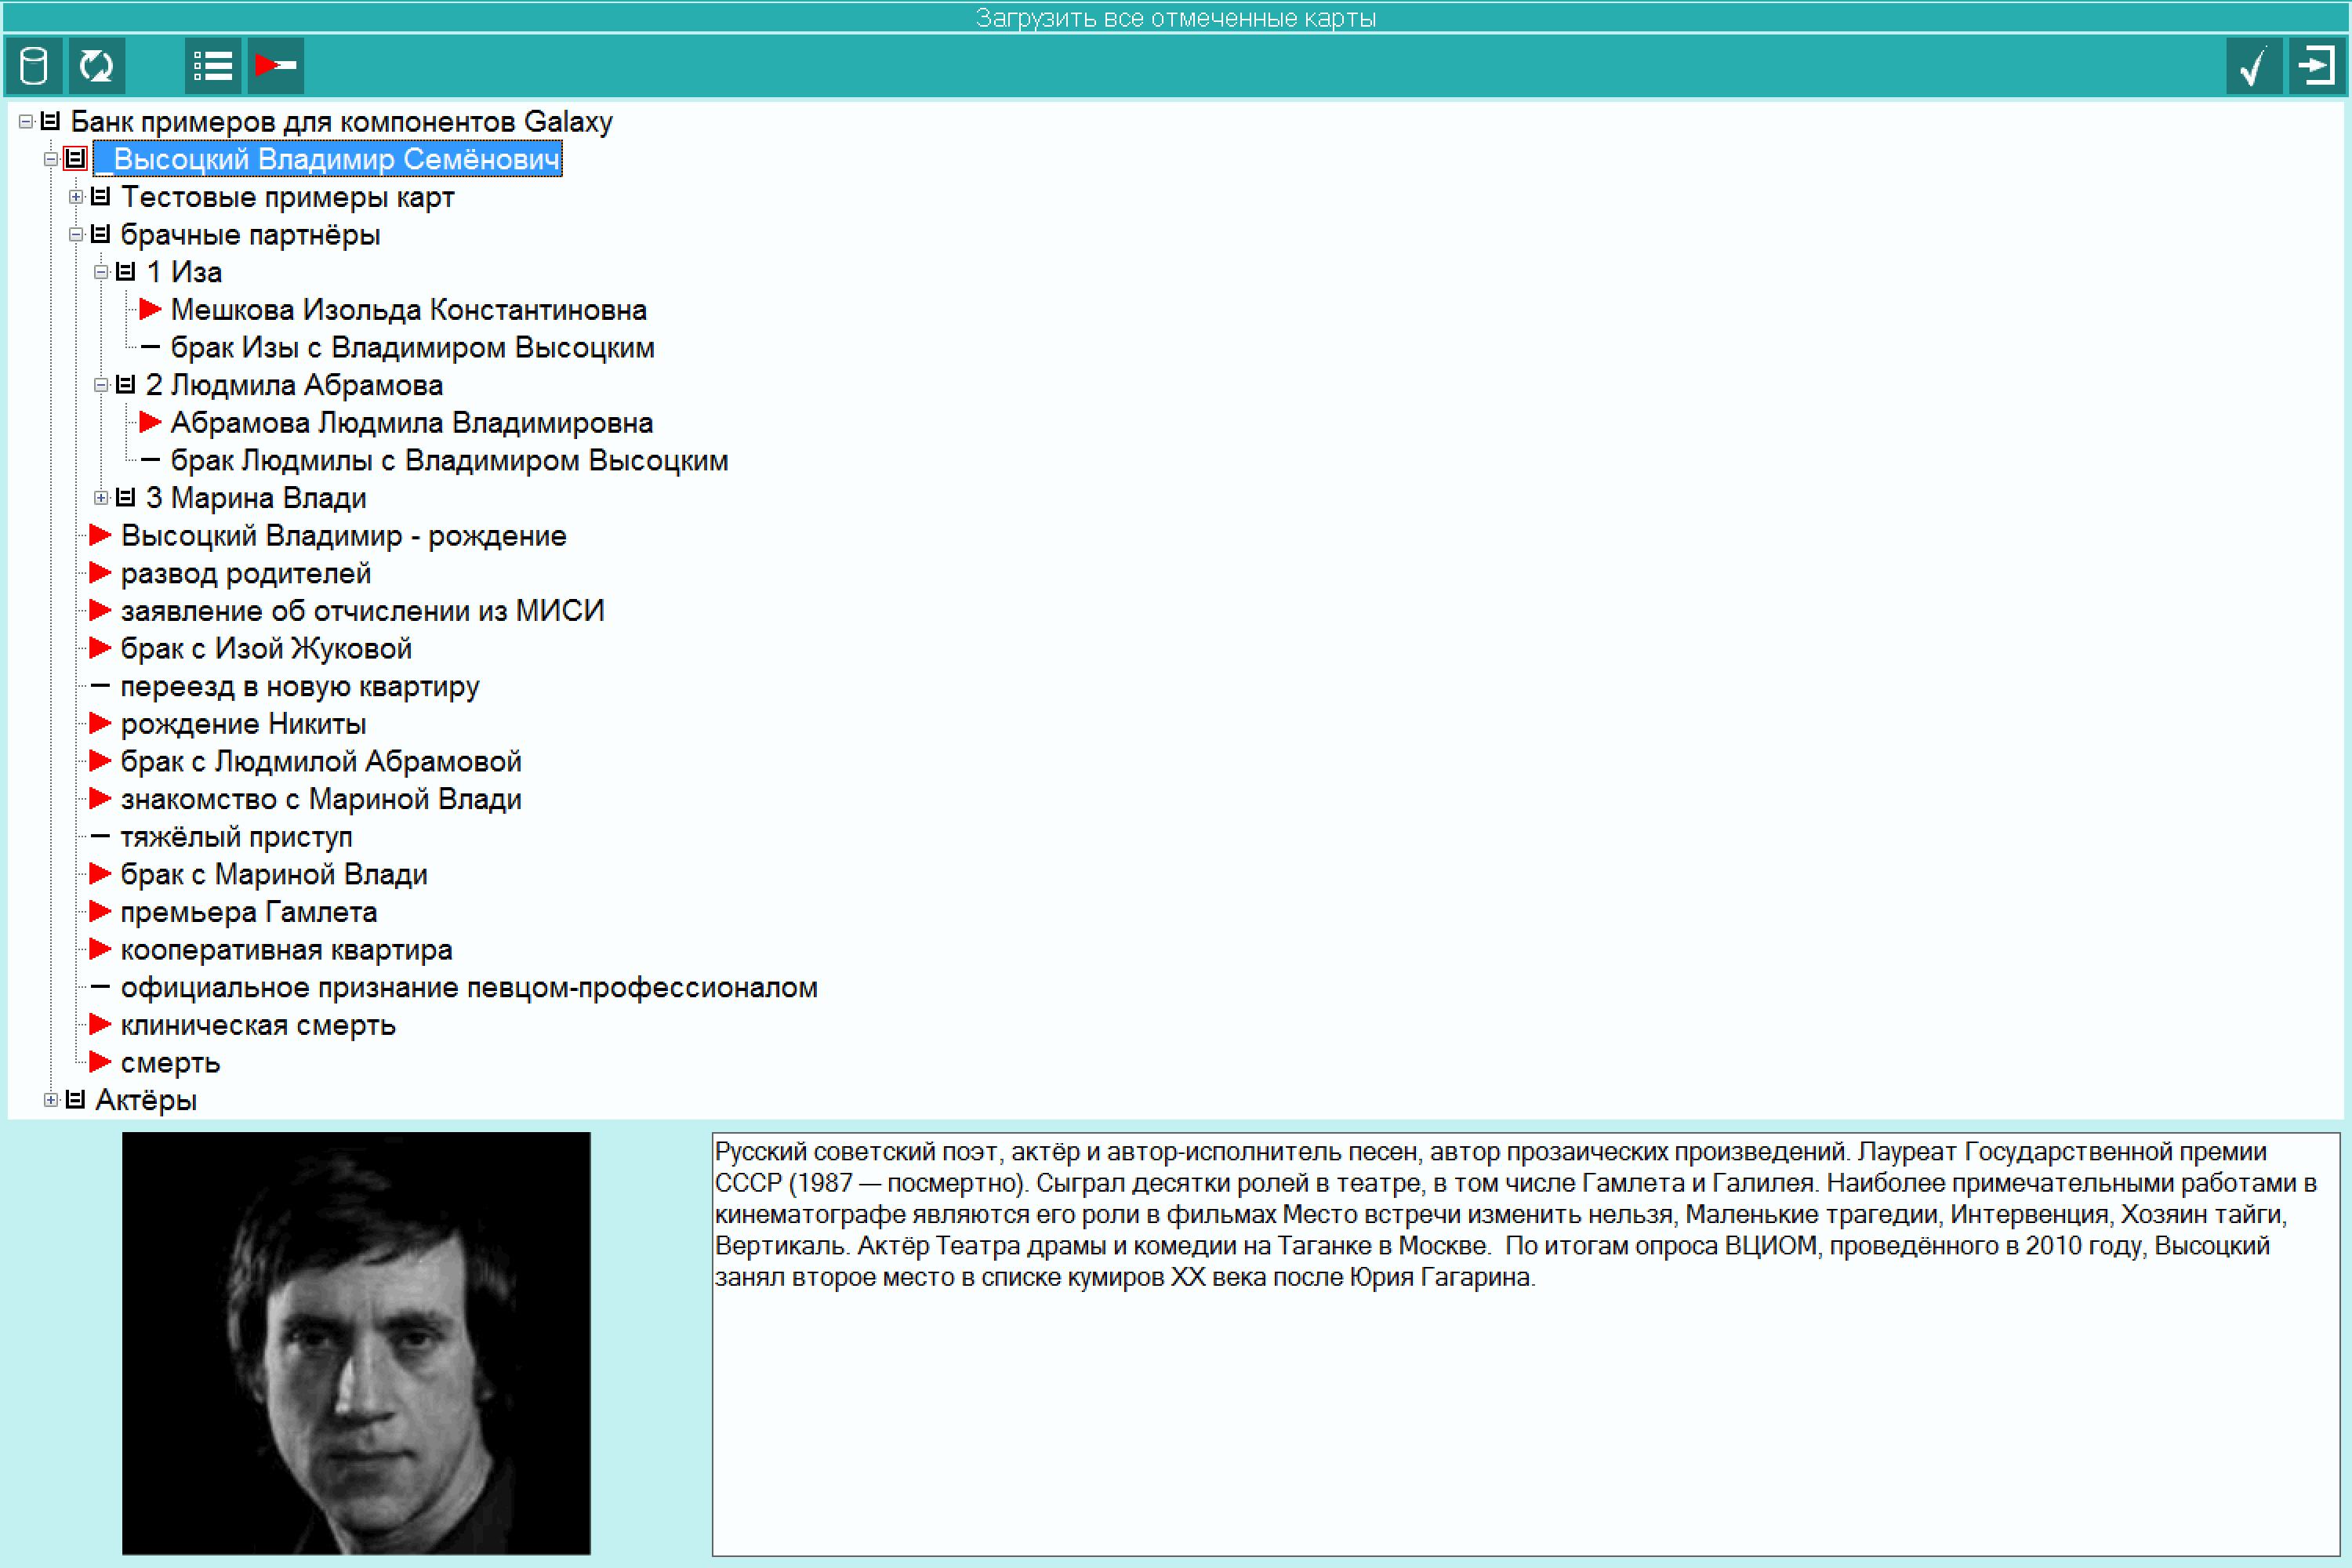 |
You can load charts as a list by ticking relevant lists in the database. It saves considerable time to create a list of charts and events for work |
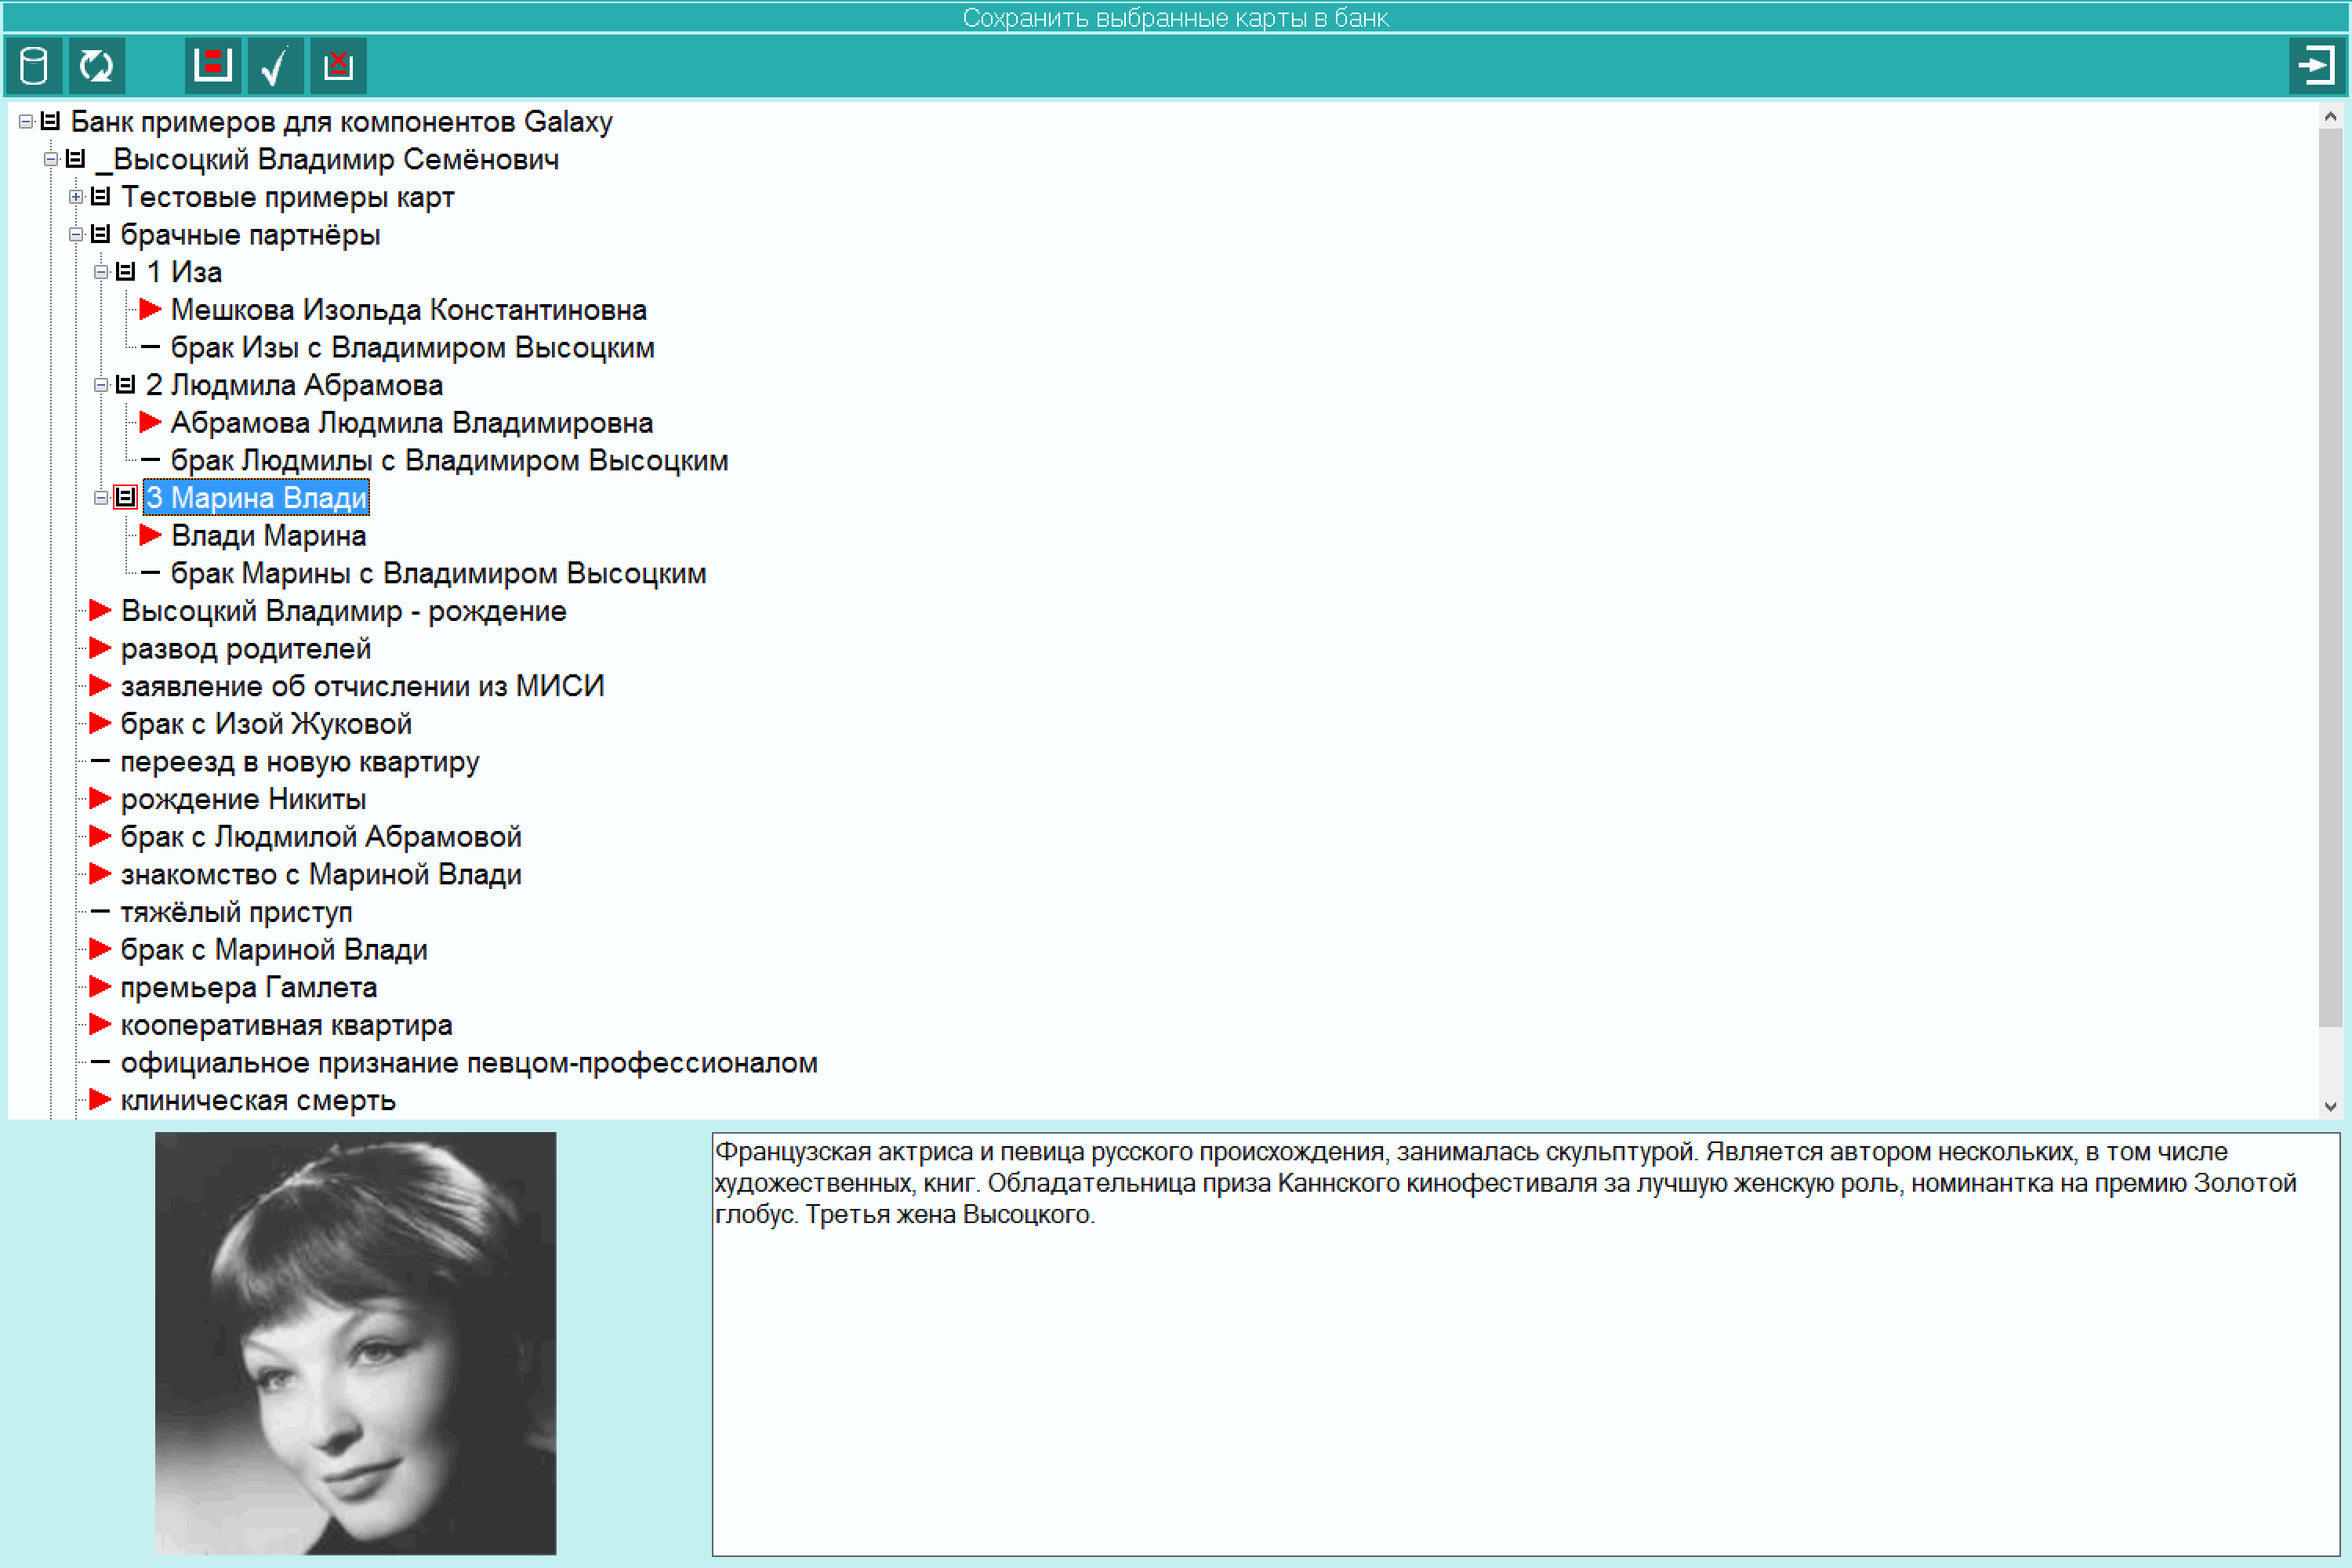 |
When you save a list of charts in the bank, previously saved charts 'remember' what folder or branch of a tree they are in. This is very important when considering the synastry of work teams and amendments to the charts |
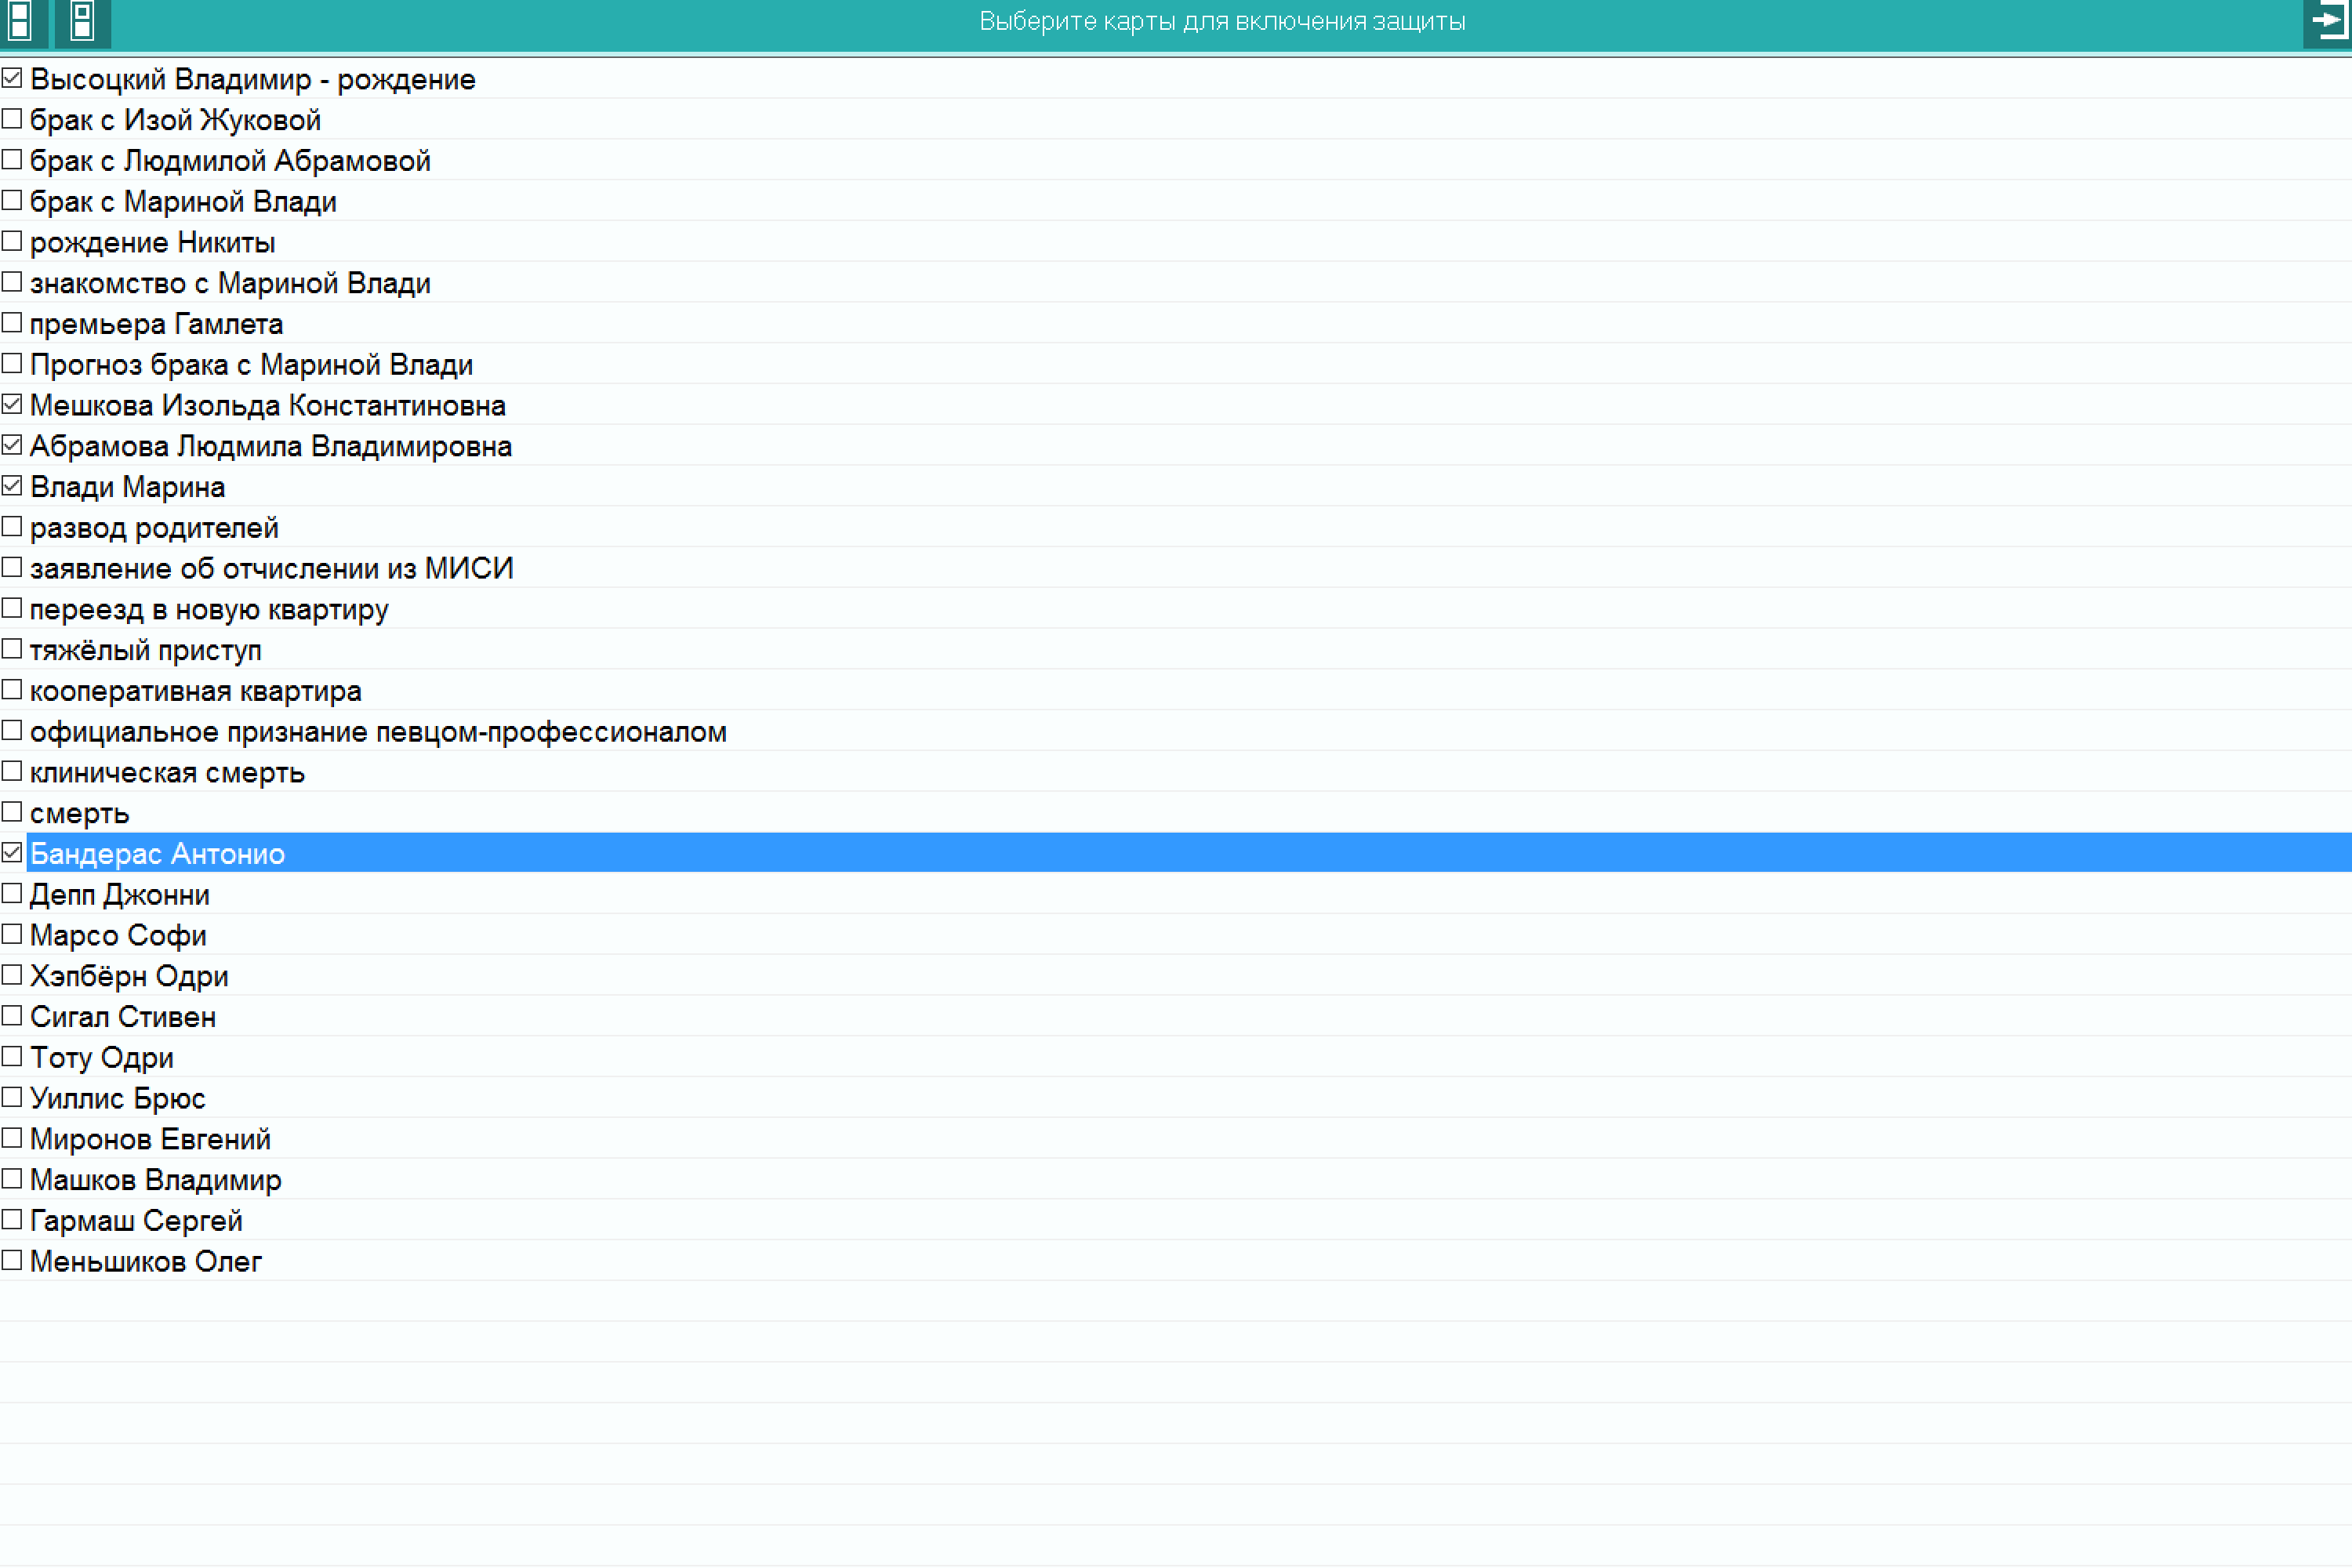 |
Galaxy programs have protection against accidental changes. Having chosen charts that should be protected, an astrologer 'lock hangs' on the chart, not giving himself and the program in the future to change the chart data. This situation is typical for the protection of event charts during the rectification, when the random change of the event time (not the natal chart) can lead to errors of rectification. |
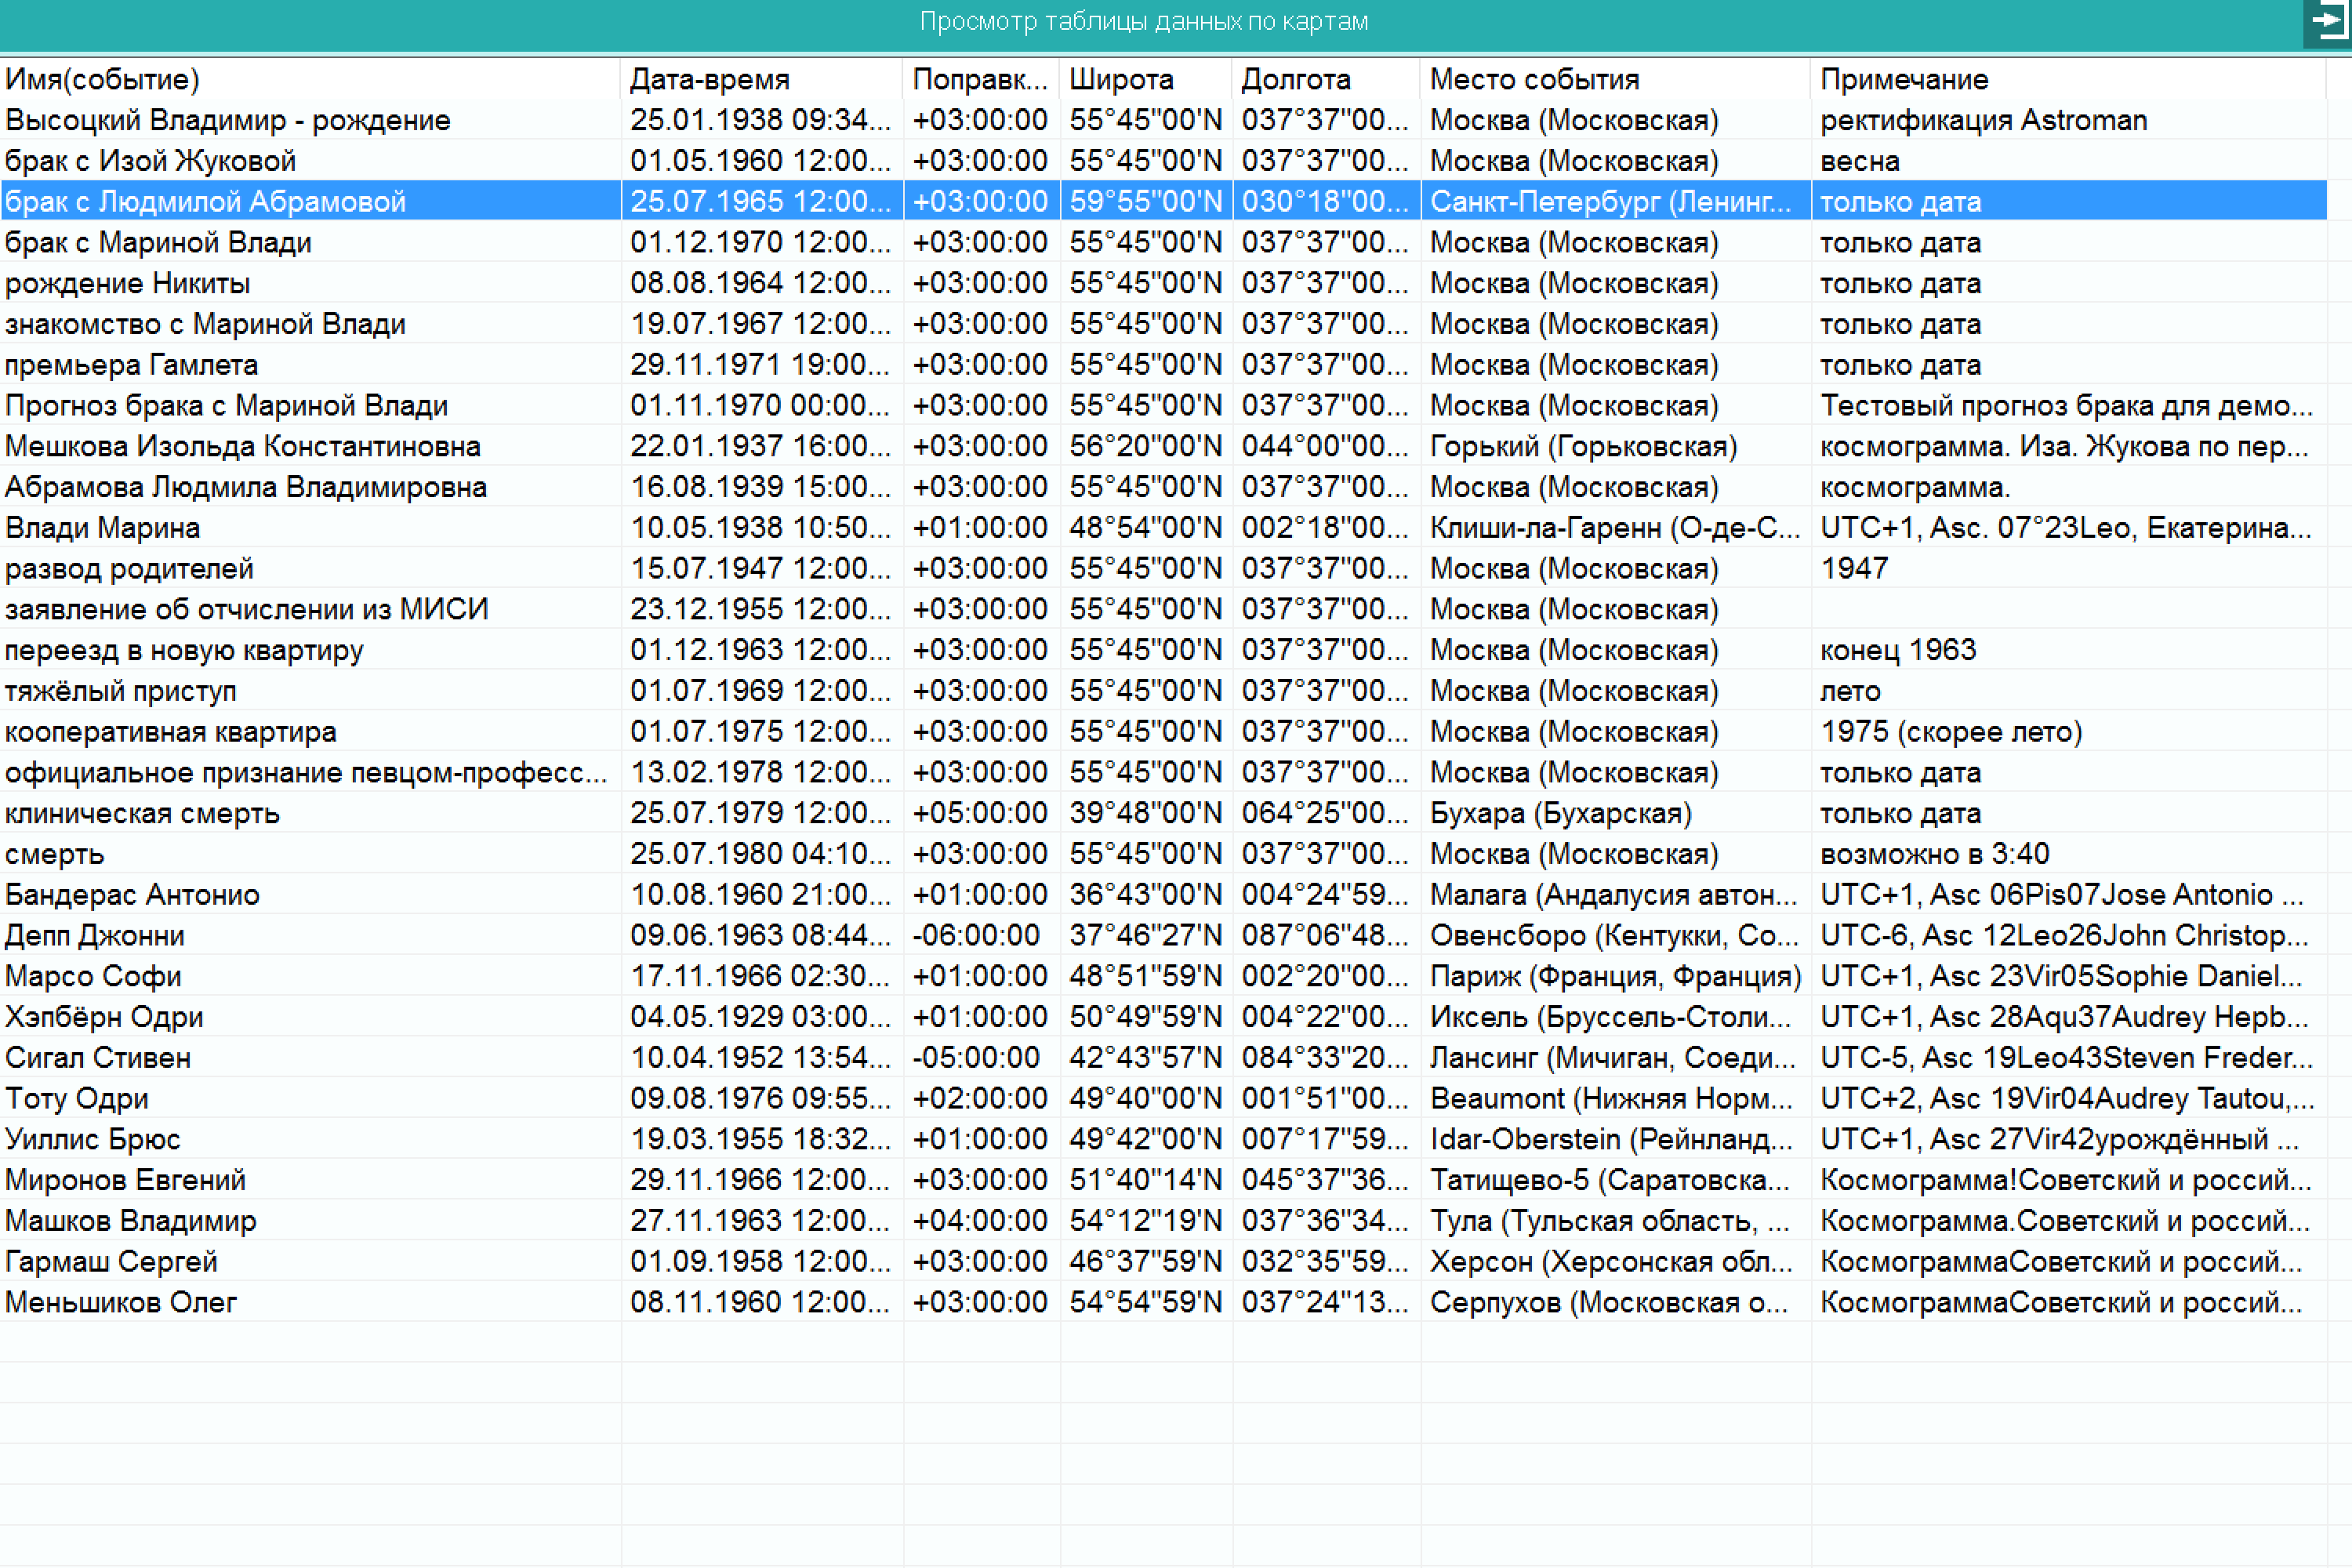 |
Global view of all charts data of a list. This allows to check the entered data and possibly catch errors in generation of the data by charts |
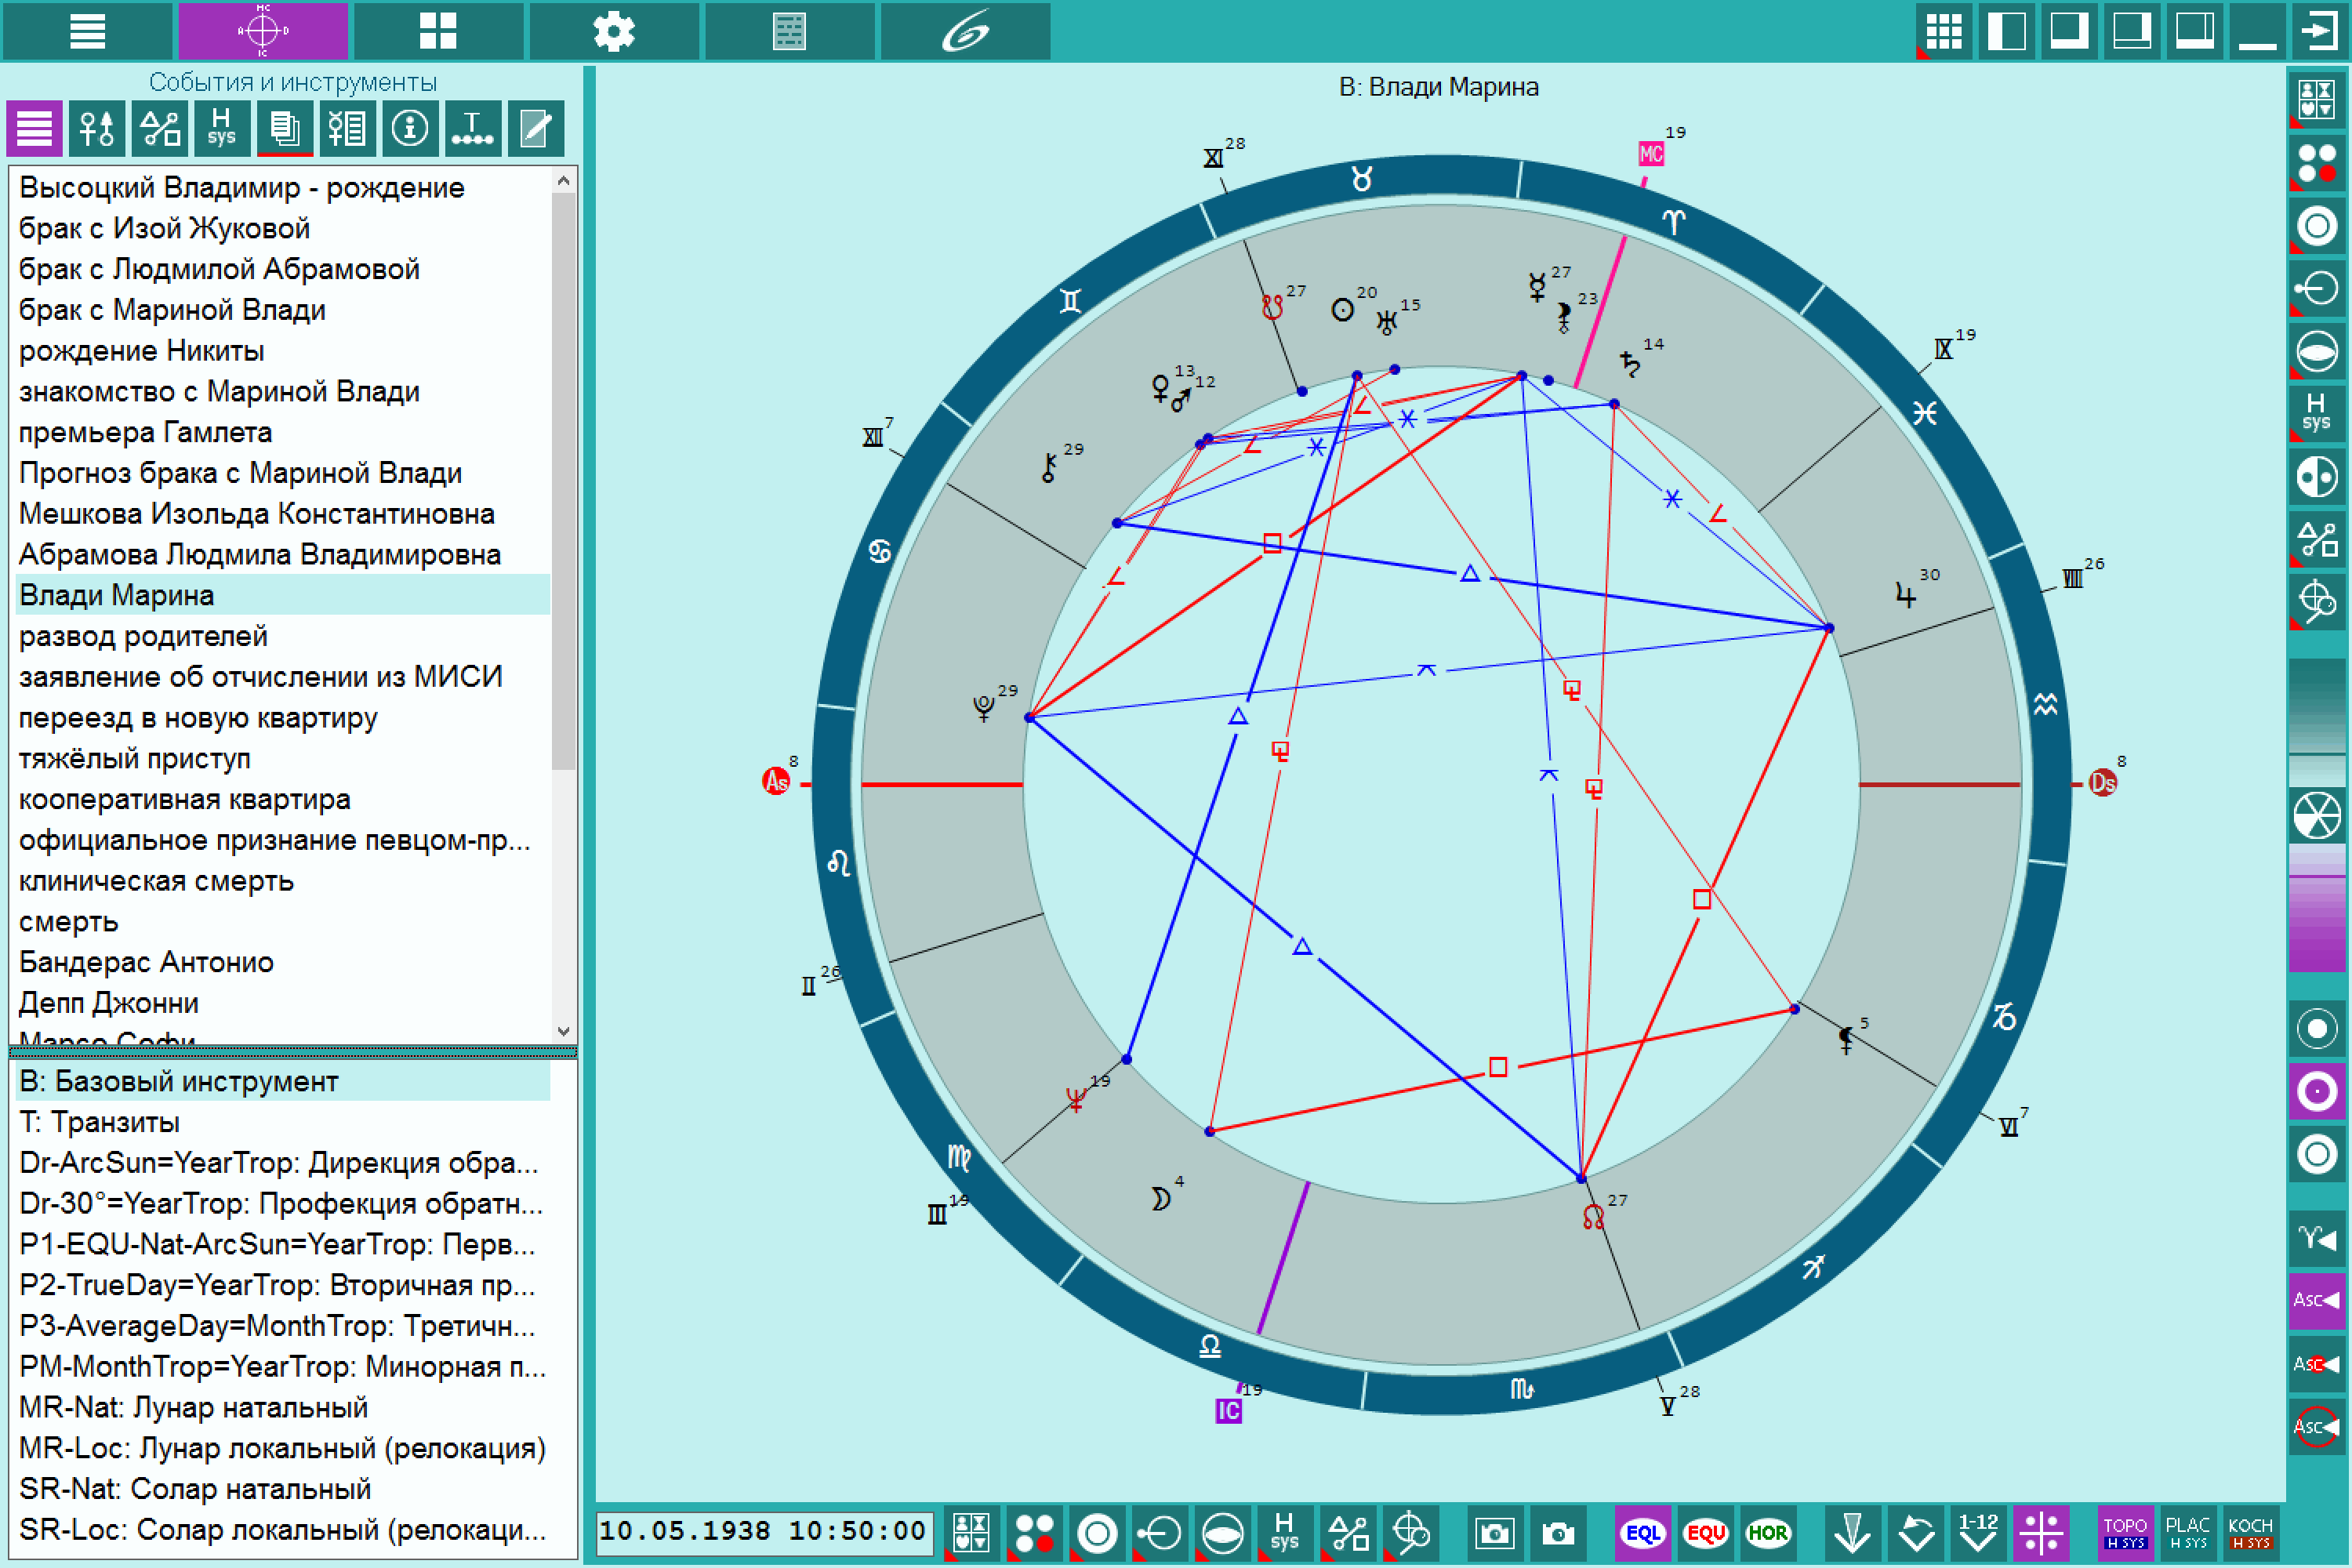 |
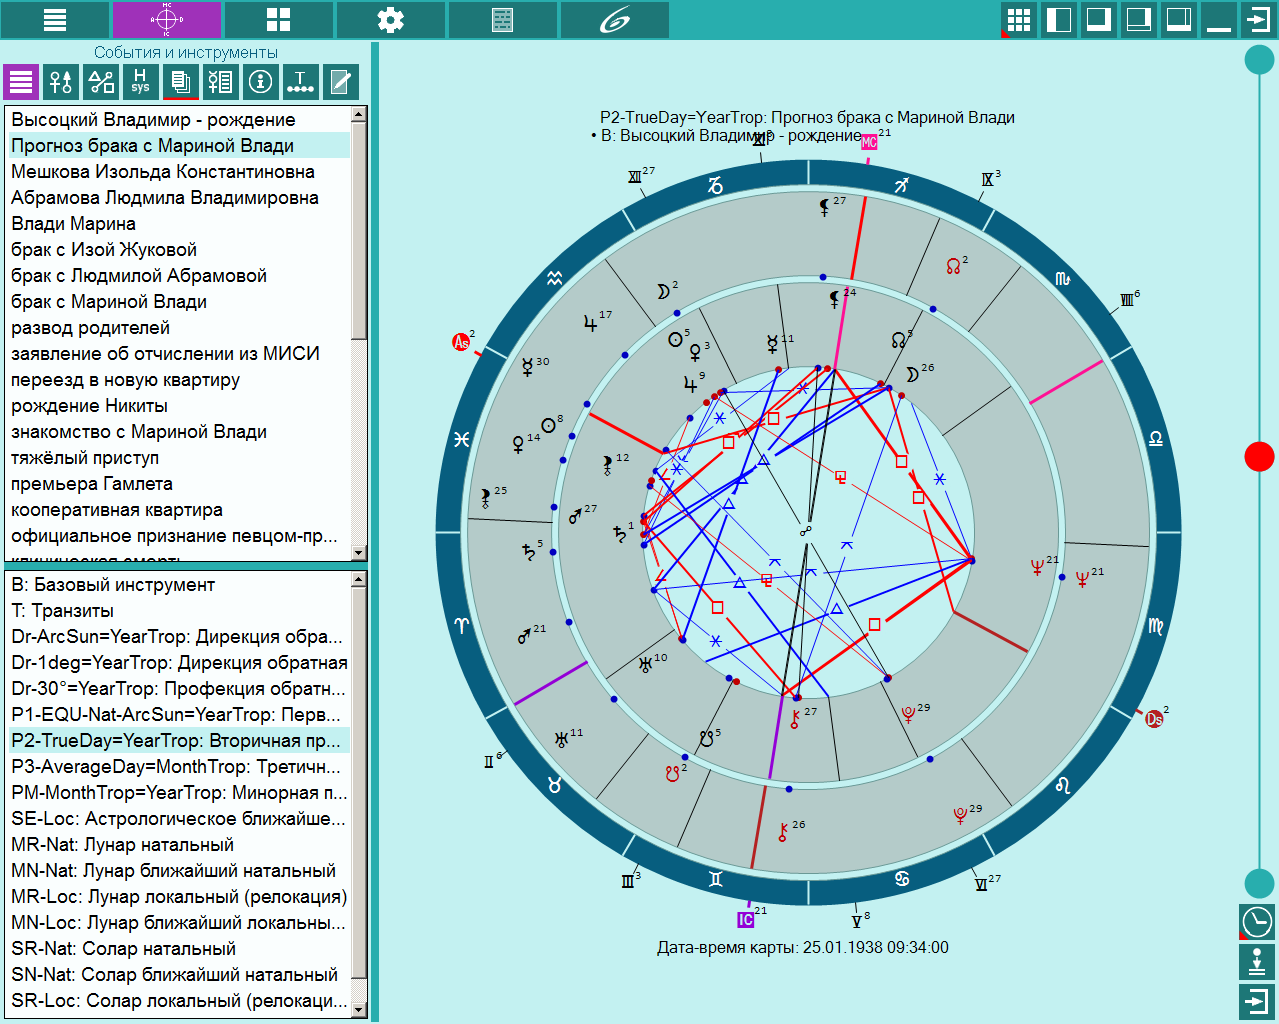
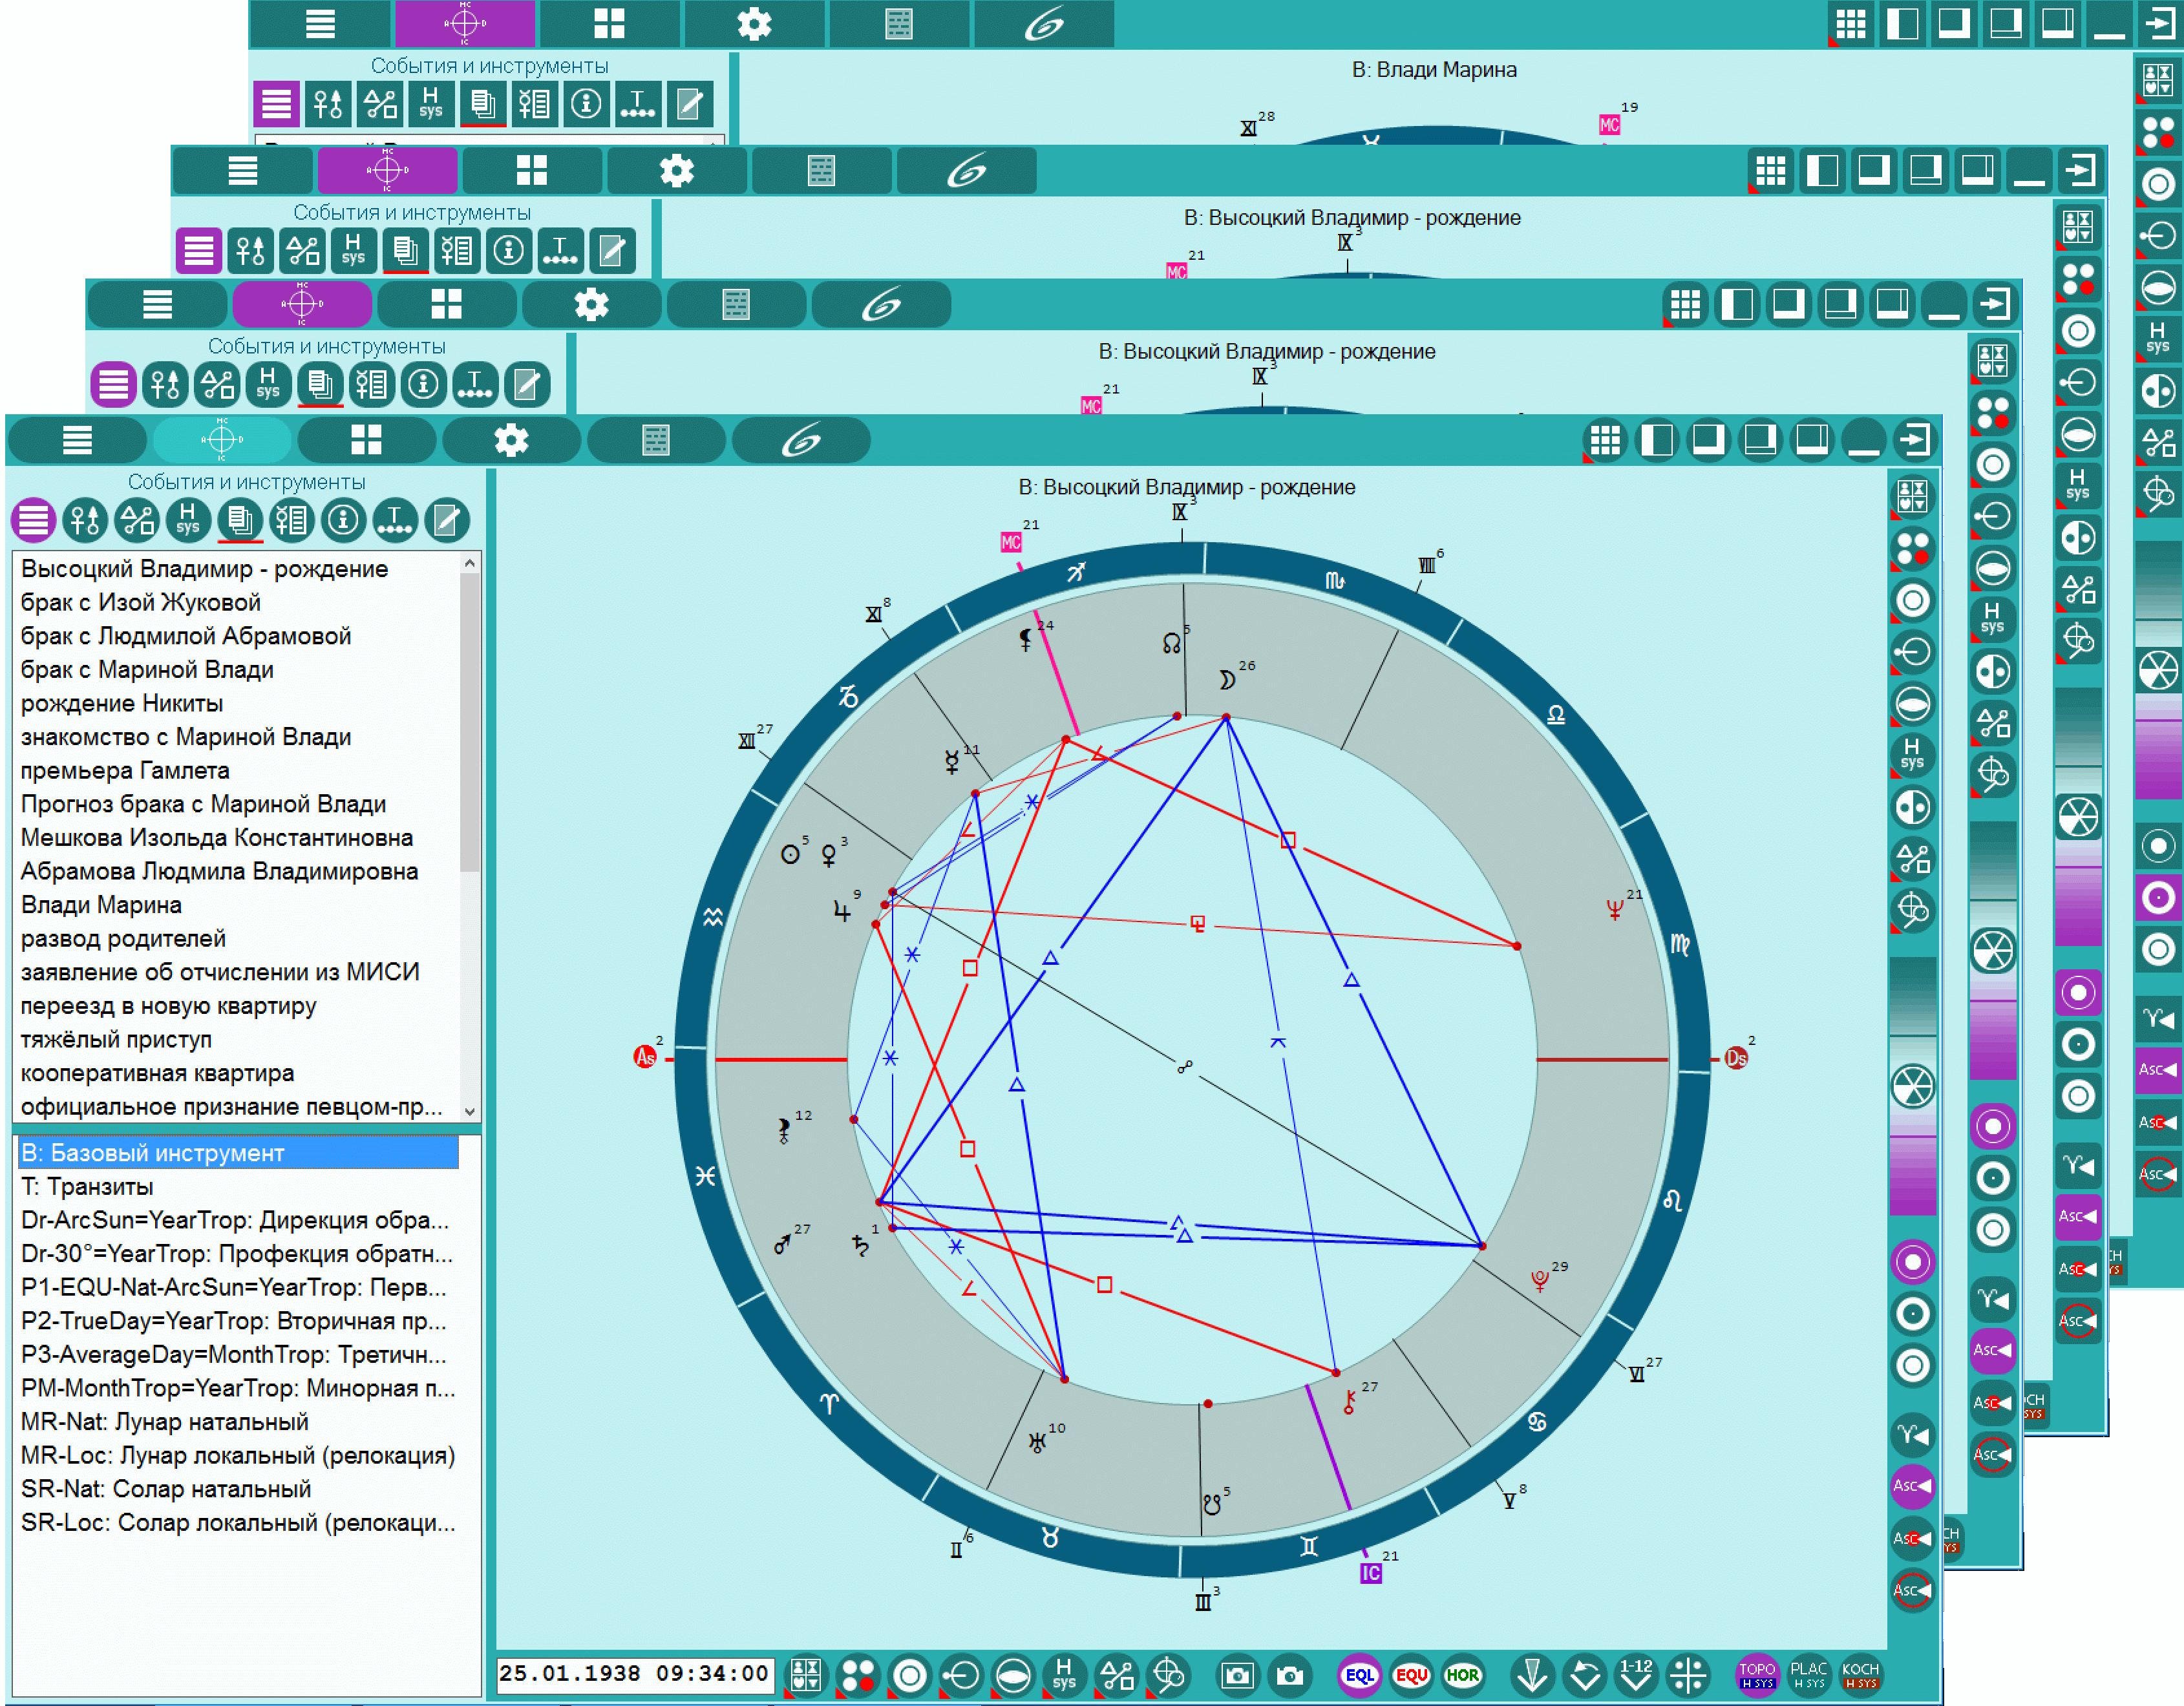
Work with a single chart. On the screen there is a multifunction panel, two customizable toolbars, depending on the operation mode and program settings. All these elements can be switched off and leave the screen with a single chart for a deeper dive into the chart |
 |
Astrological parameters of chart objects on the multifunction panel. To display the objects in a table the different modes can be used: the table of objects, 30-degree table, etc. The table can be sorted by clicking the mouse on the title |
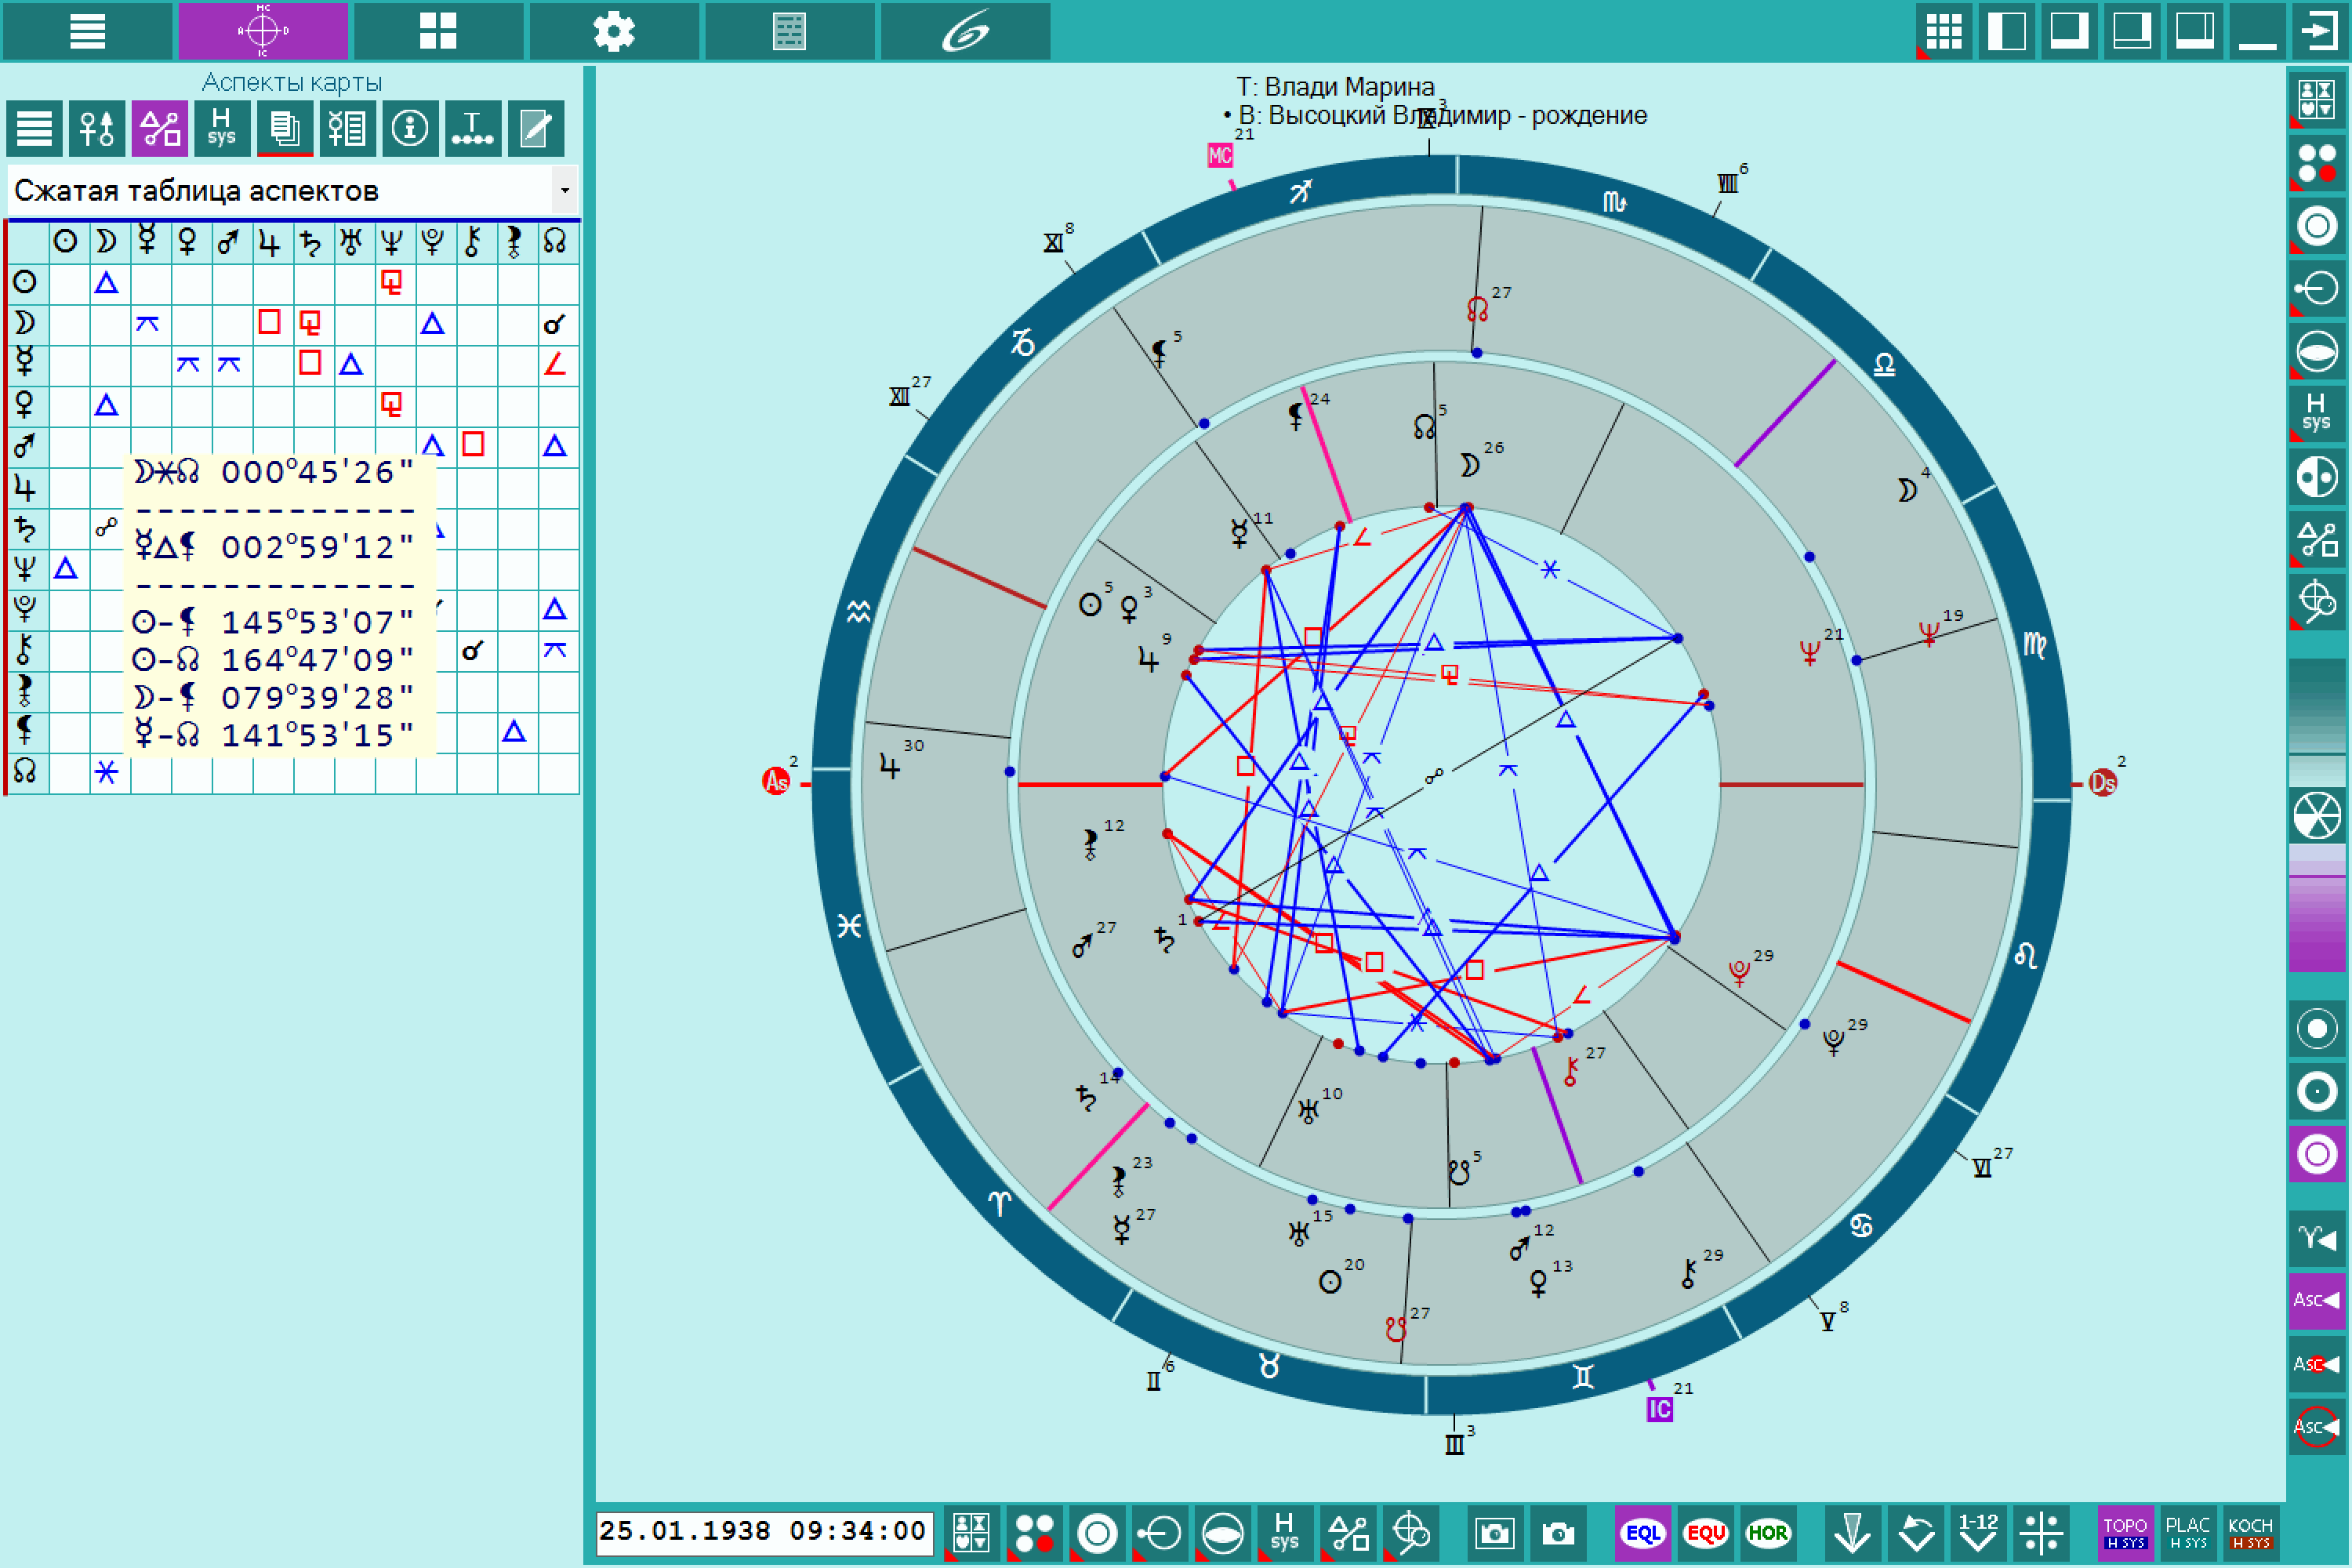 |
Aspects of the charts can be displayed in different modes: from the compressed/full (complete) table to the tabular presentation of aspect chain in relation to the inner or outer charts. In addition, you can get more information by clicking on the table on the desired aspect. At the same time, the program shows information not only at the point of contact, but also around. It allows to determine the degree measure even when lack of aspects |
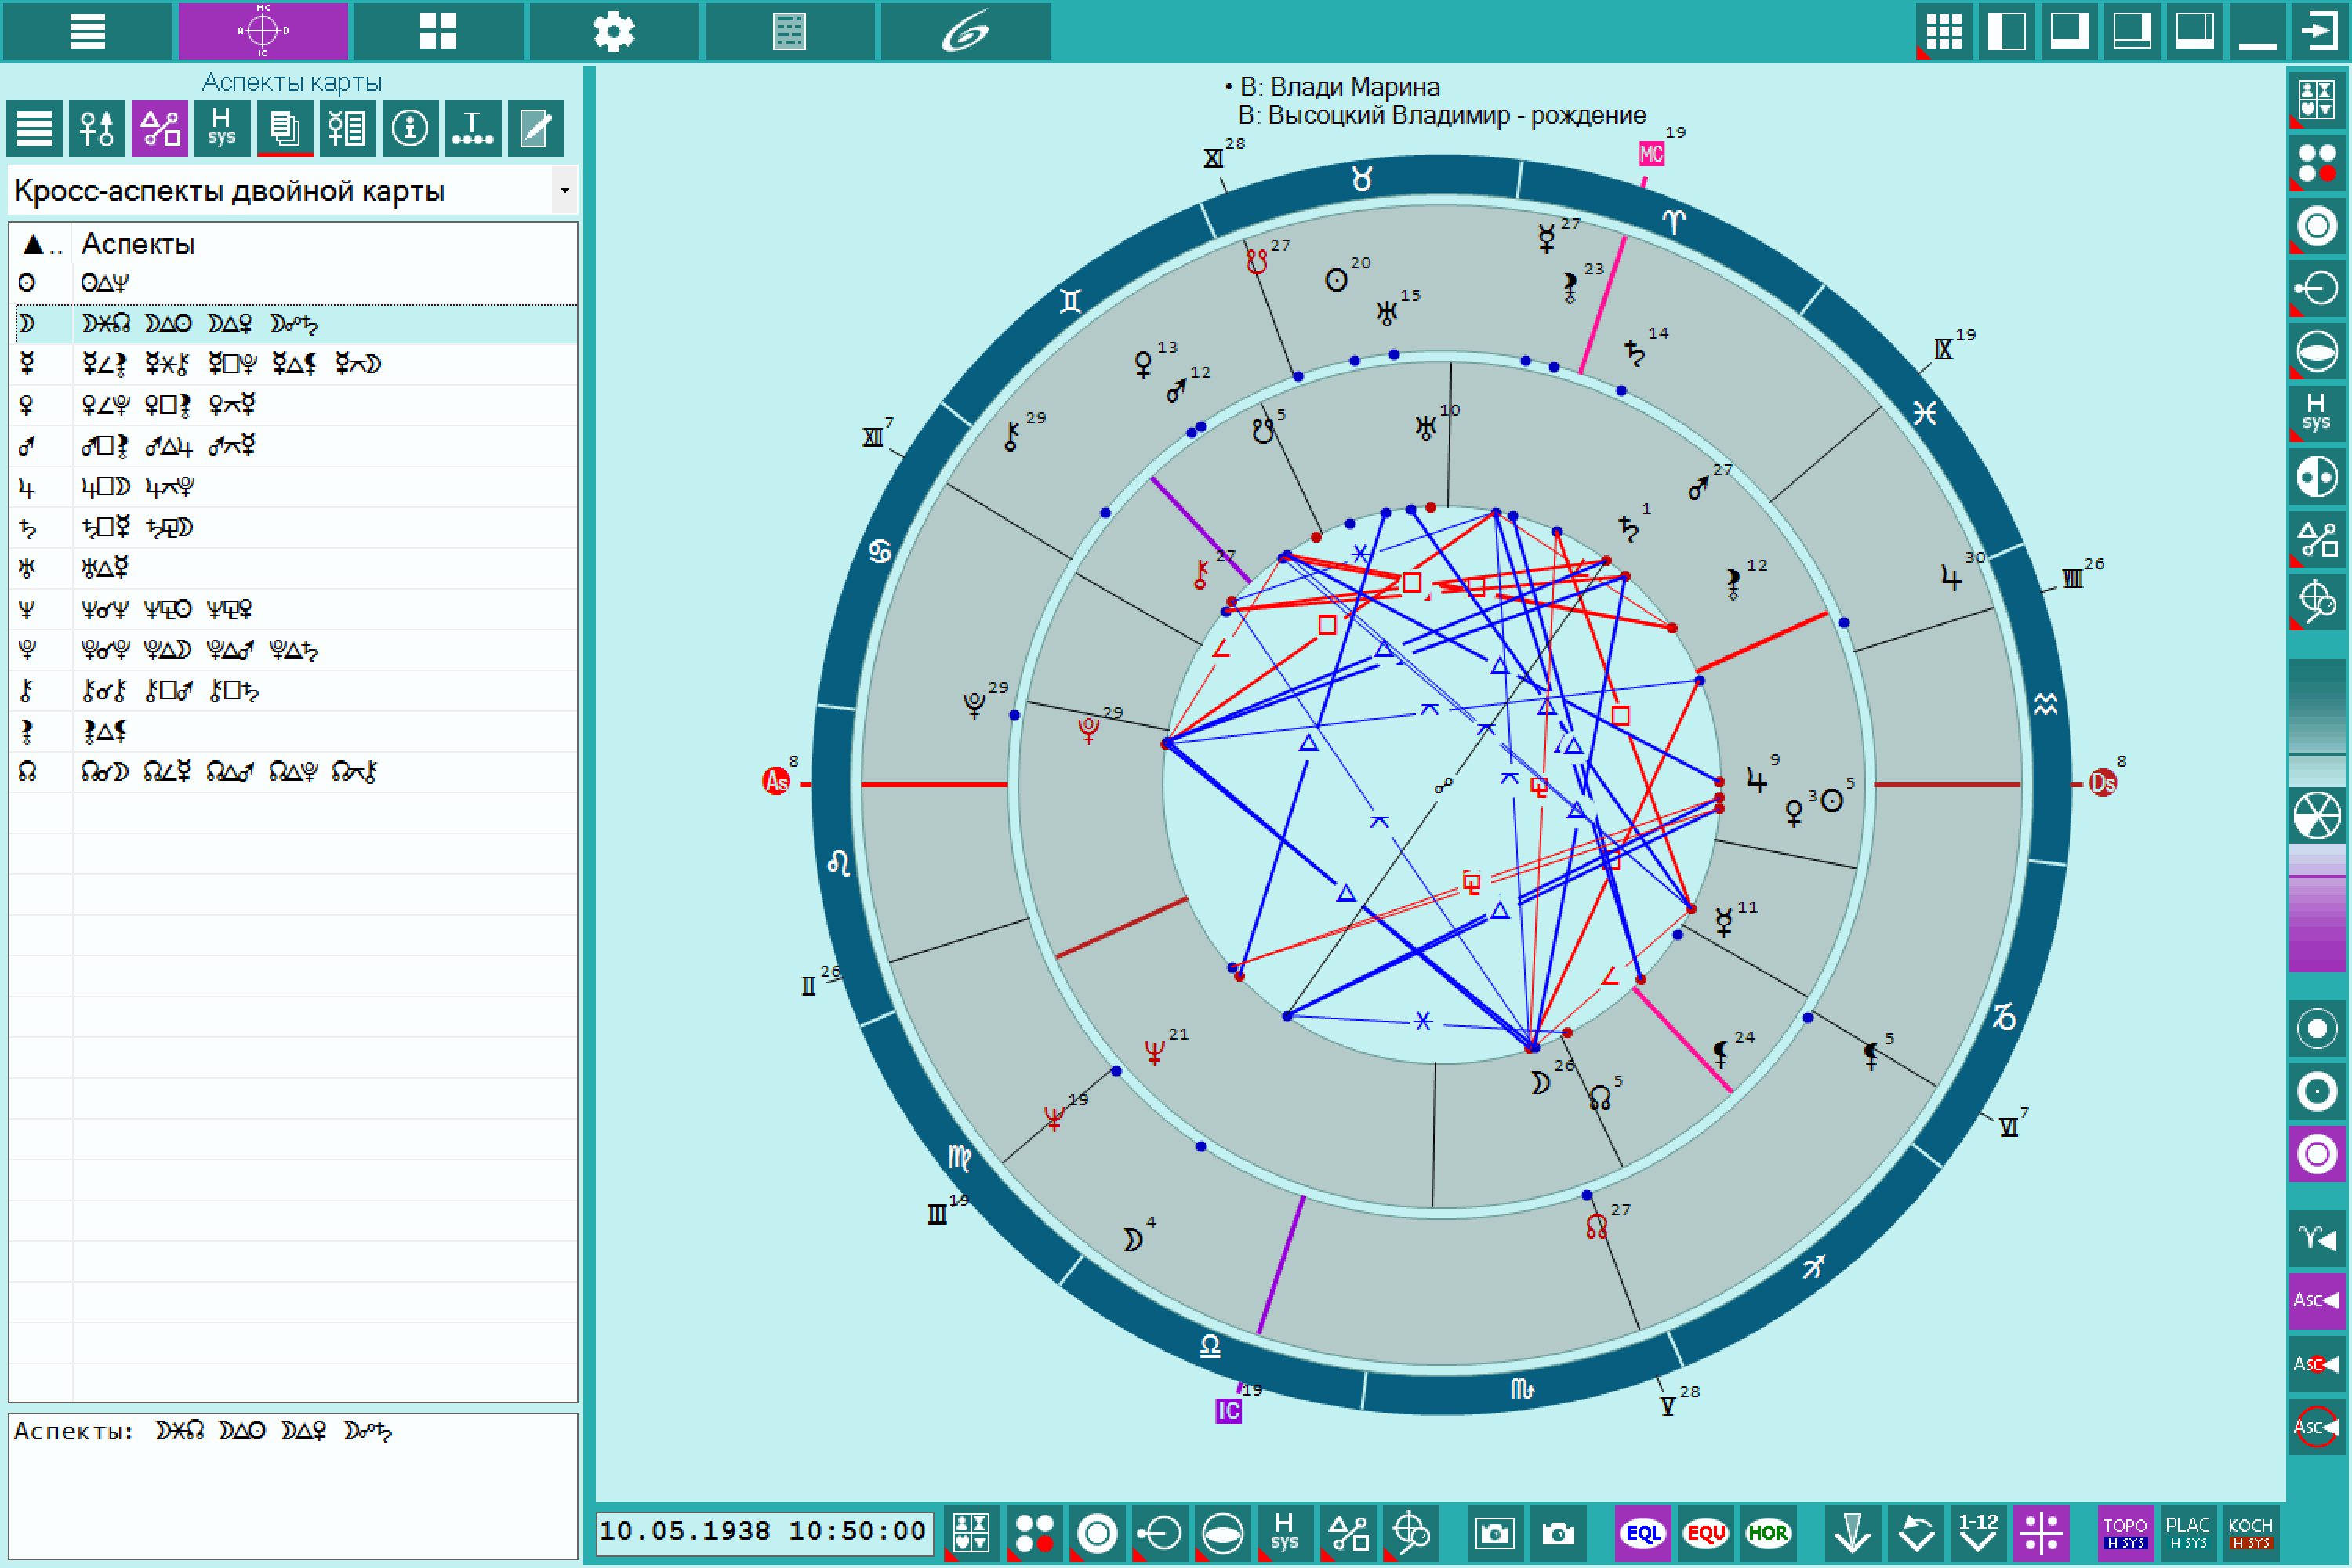 |
The cross-aspects of the dual chart, displayed in tabular form. This is one of many options to display aspects |
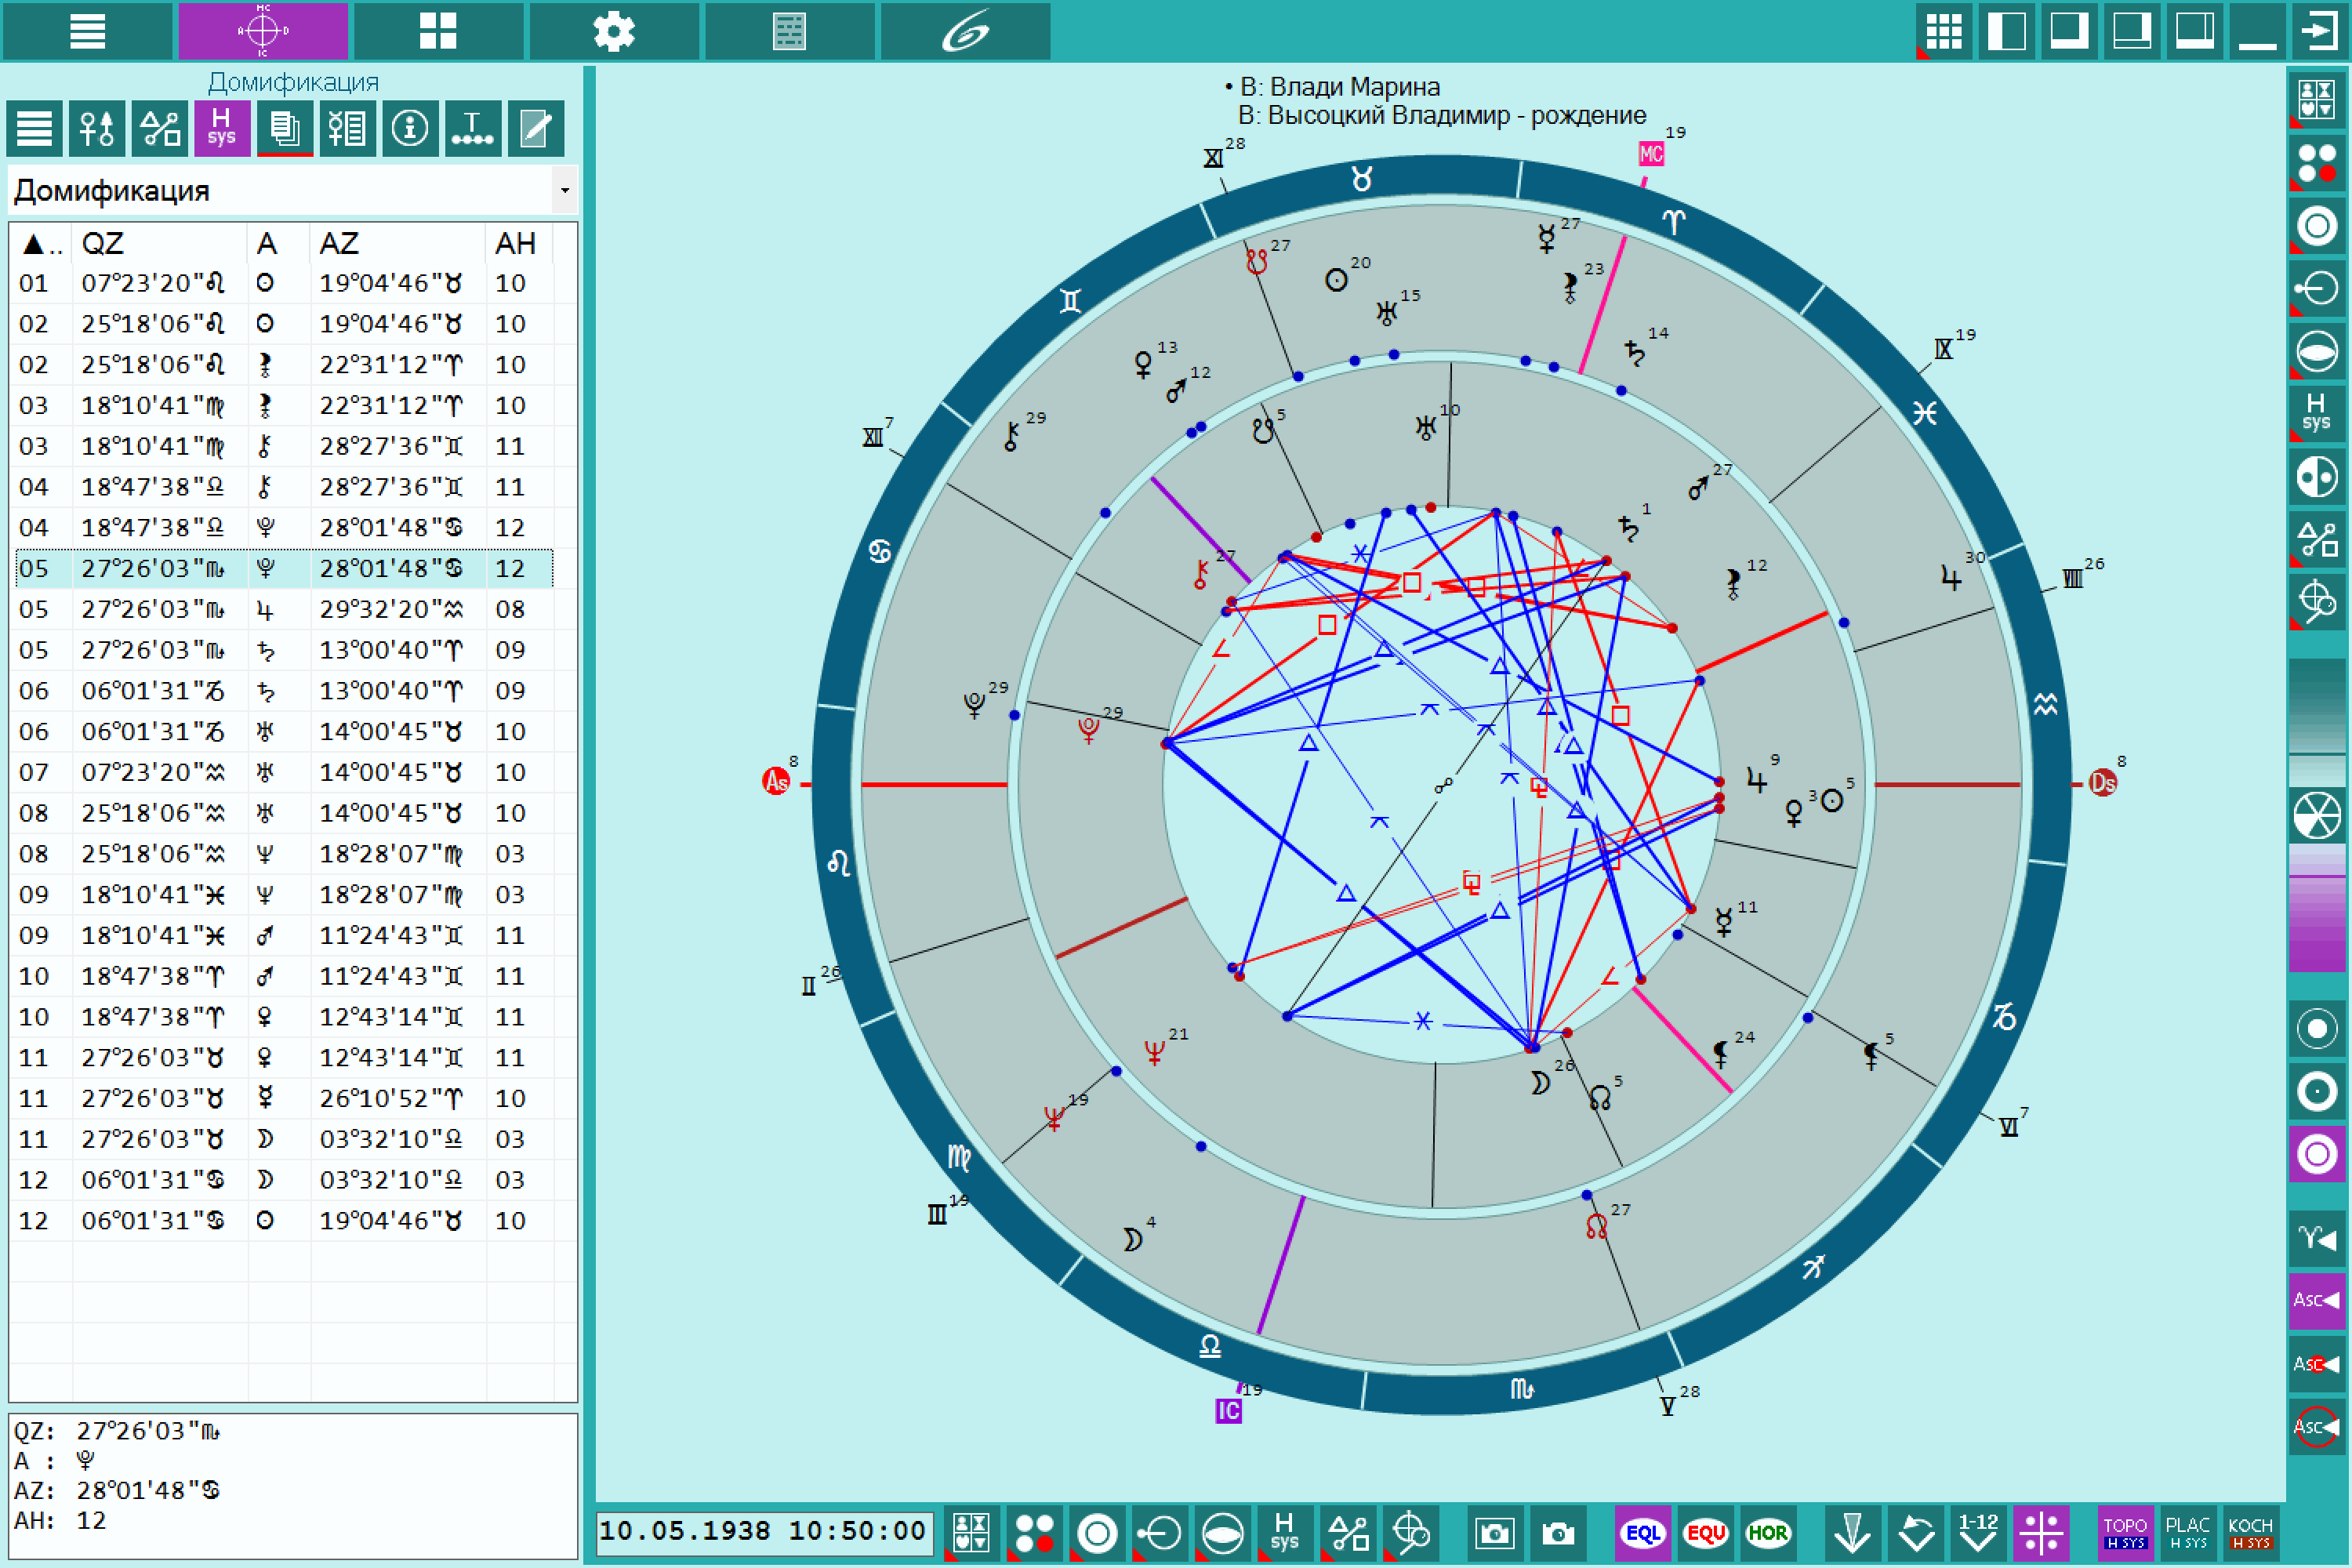 |
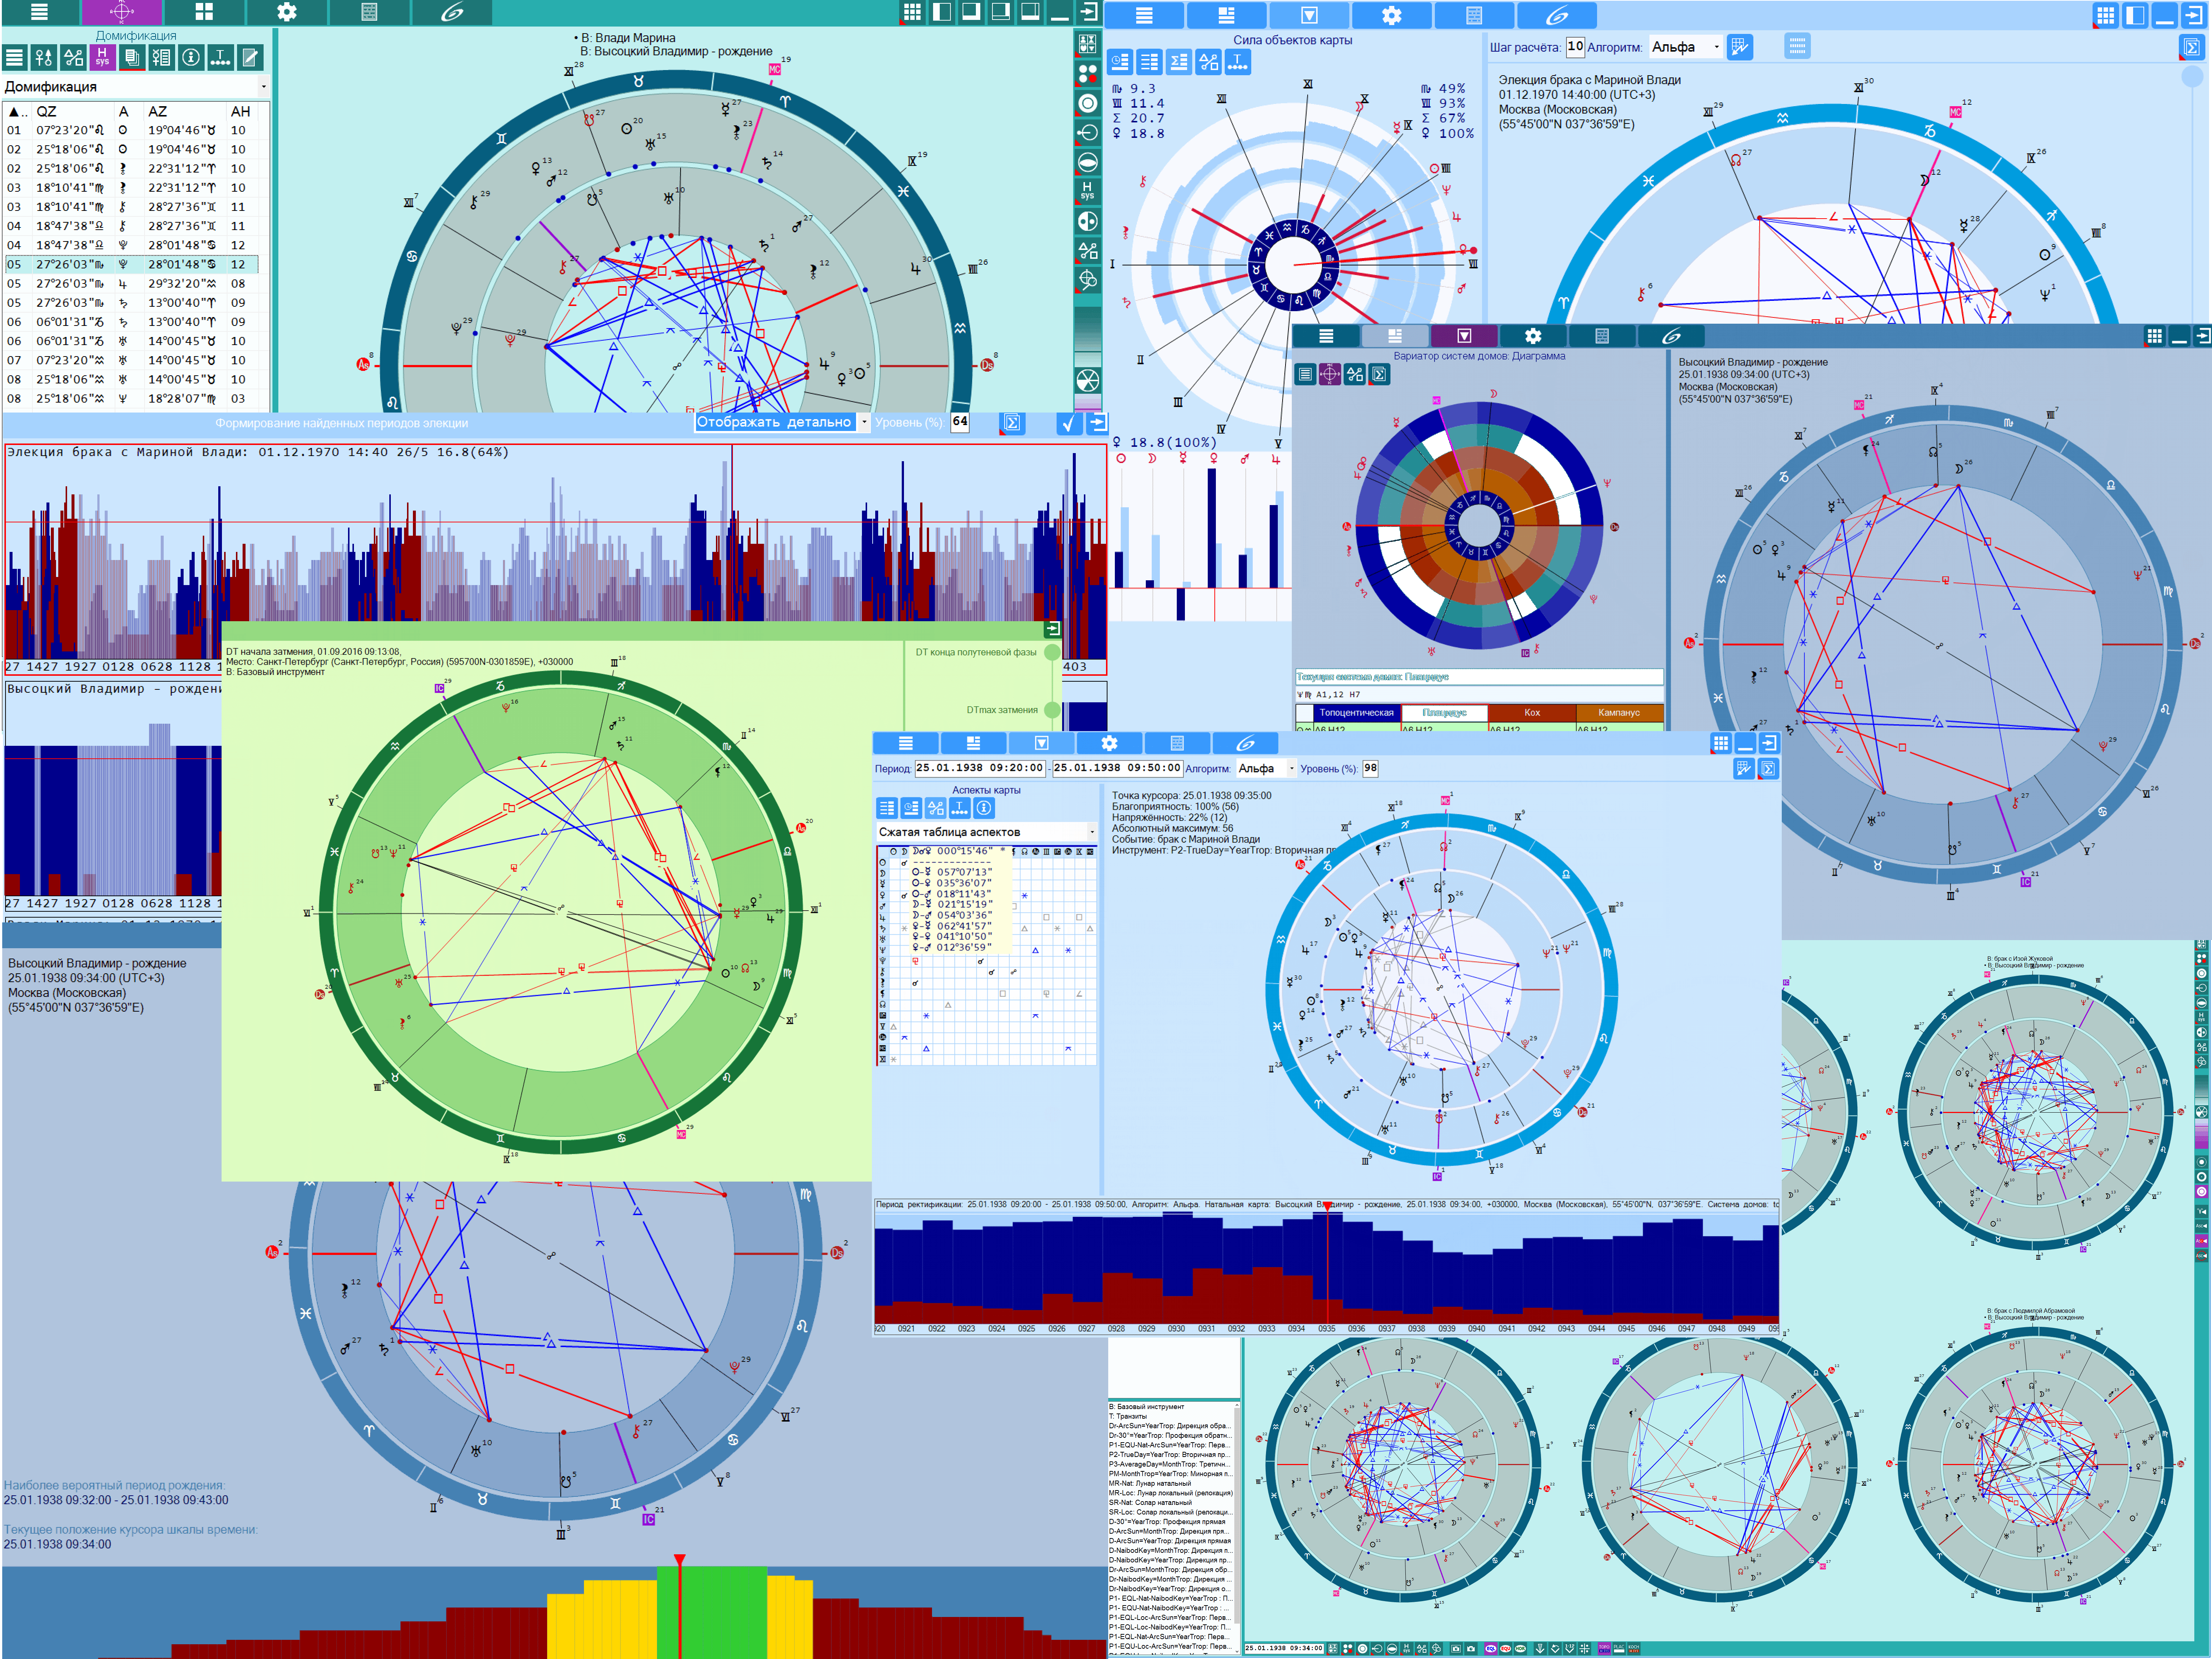
The table of domification allows to get comprehensive assessment of the chart objects as rulers in the houses and signs |
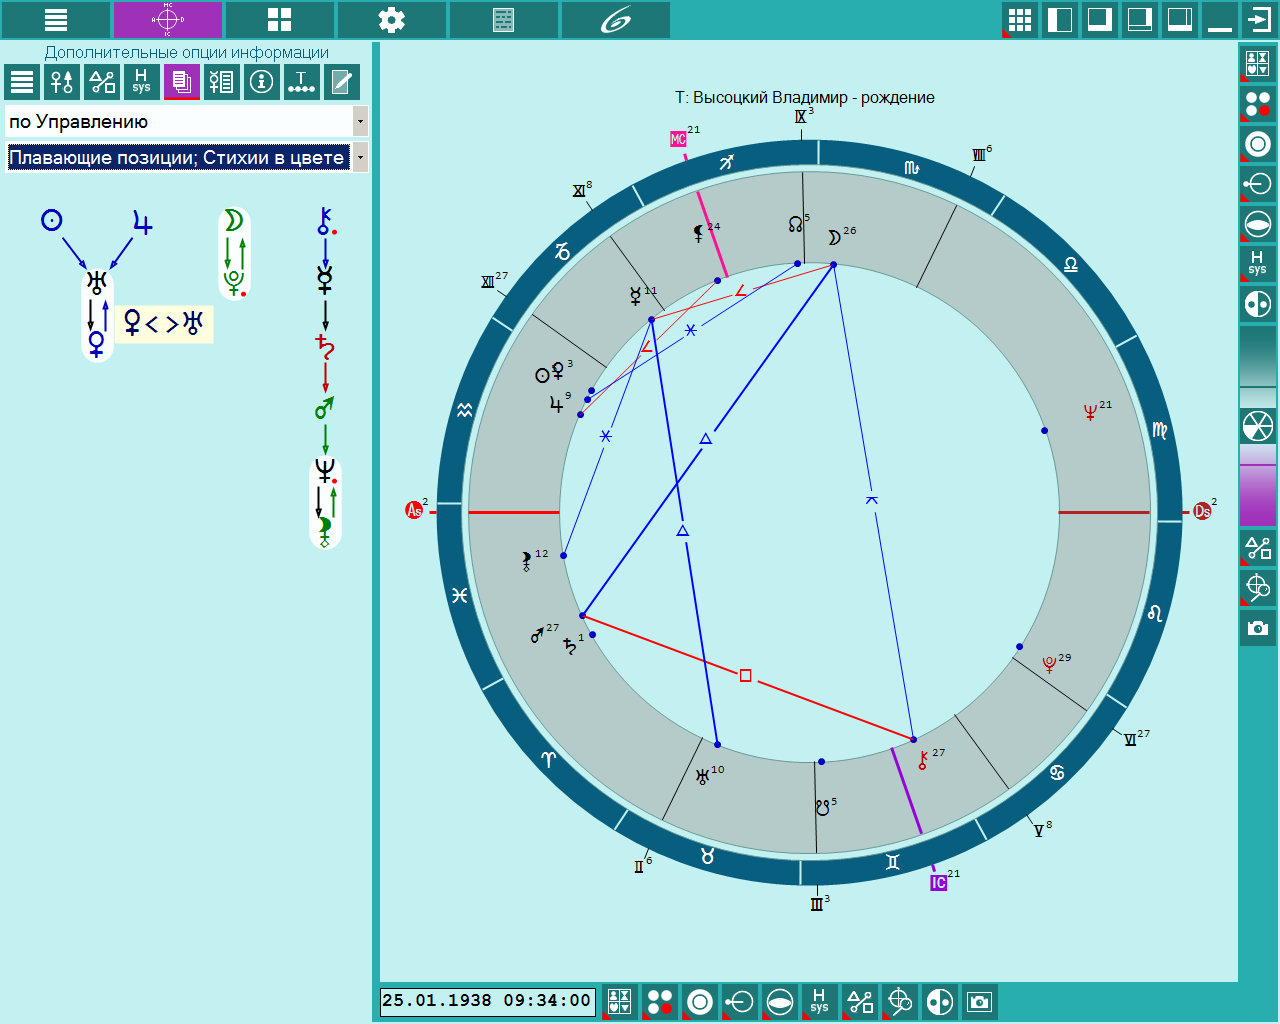 |
Additional options information - Chain of dispositors. You can use various chains of control to fall for the full control of the table and Septener. Position rulers in chains dispositor is not fixed and depends on the chart. Stewards took place, the most suitable to avoid crossing links. The color of the ruler and communication are painted in the colors of the elements in which it is located: Fire - red, Earth - black, Air - blue and Water - green. The red dot next to its planet is retrograde. |
 |
Additional options information - Chain of dispositors. You can use various chains of control to fall for the full control of the table and Septener. Position rulers in chains dispositor fixed. Those. stewards are on the same ground, regardless of the chart, and communication vary according to the chart. The color of the ruler and communication are painted in the colors of the elements in which it is located: Fire - red, Earth - black, Air - blue and Water - green. The red dot next to its planet is retrograde. |
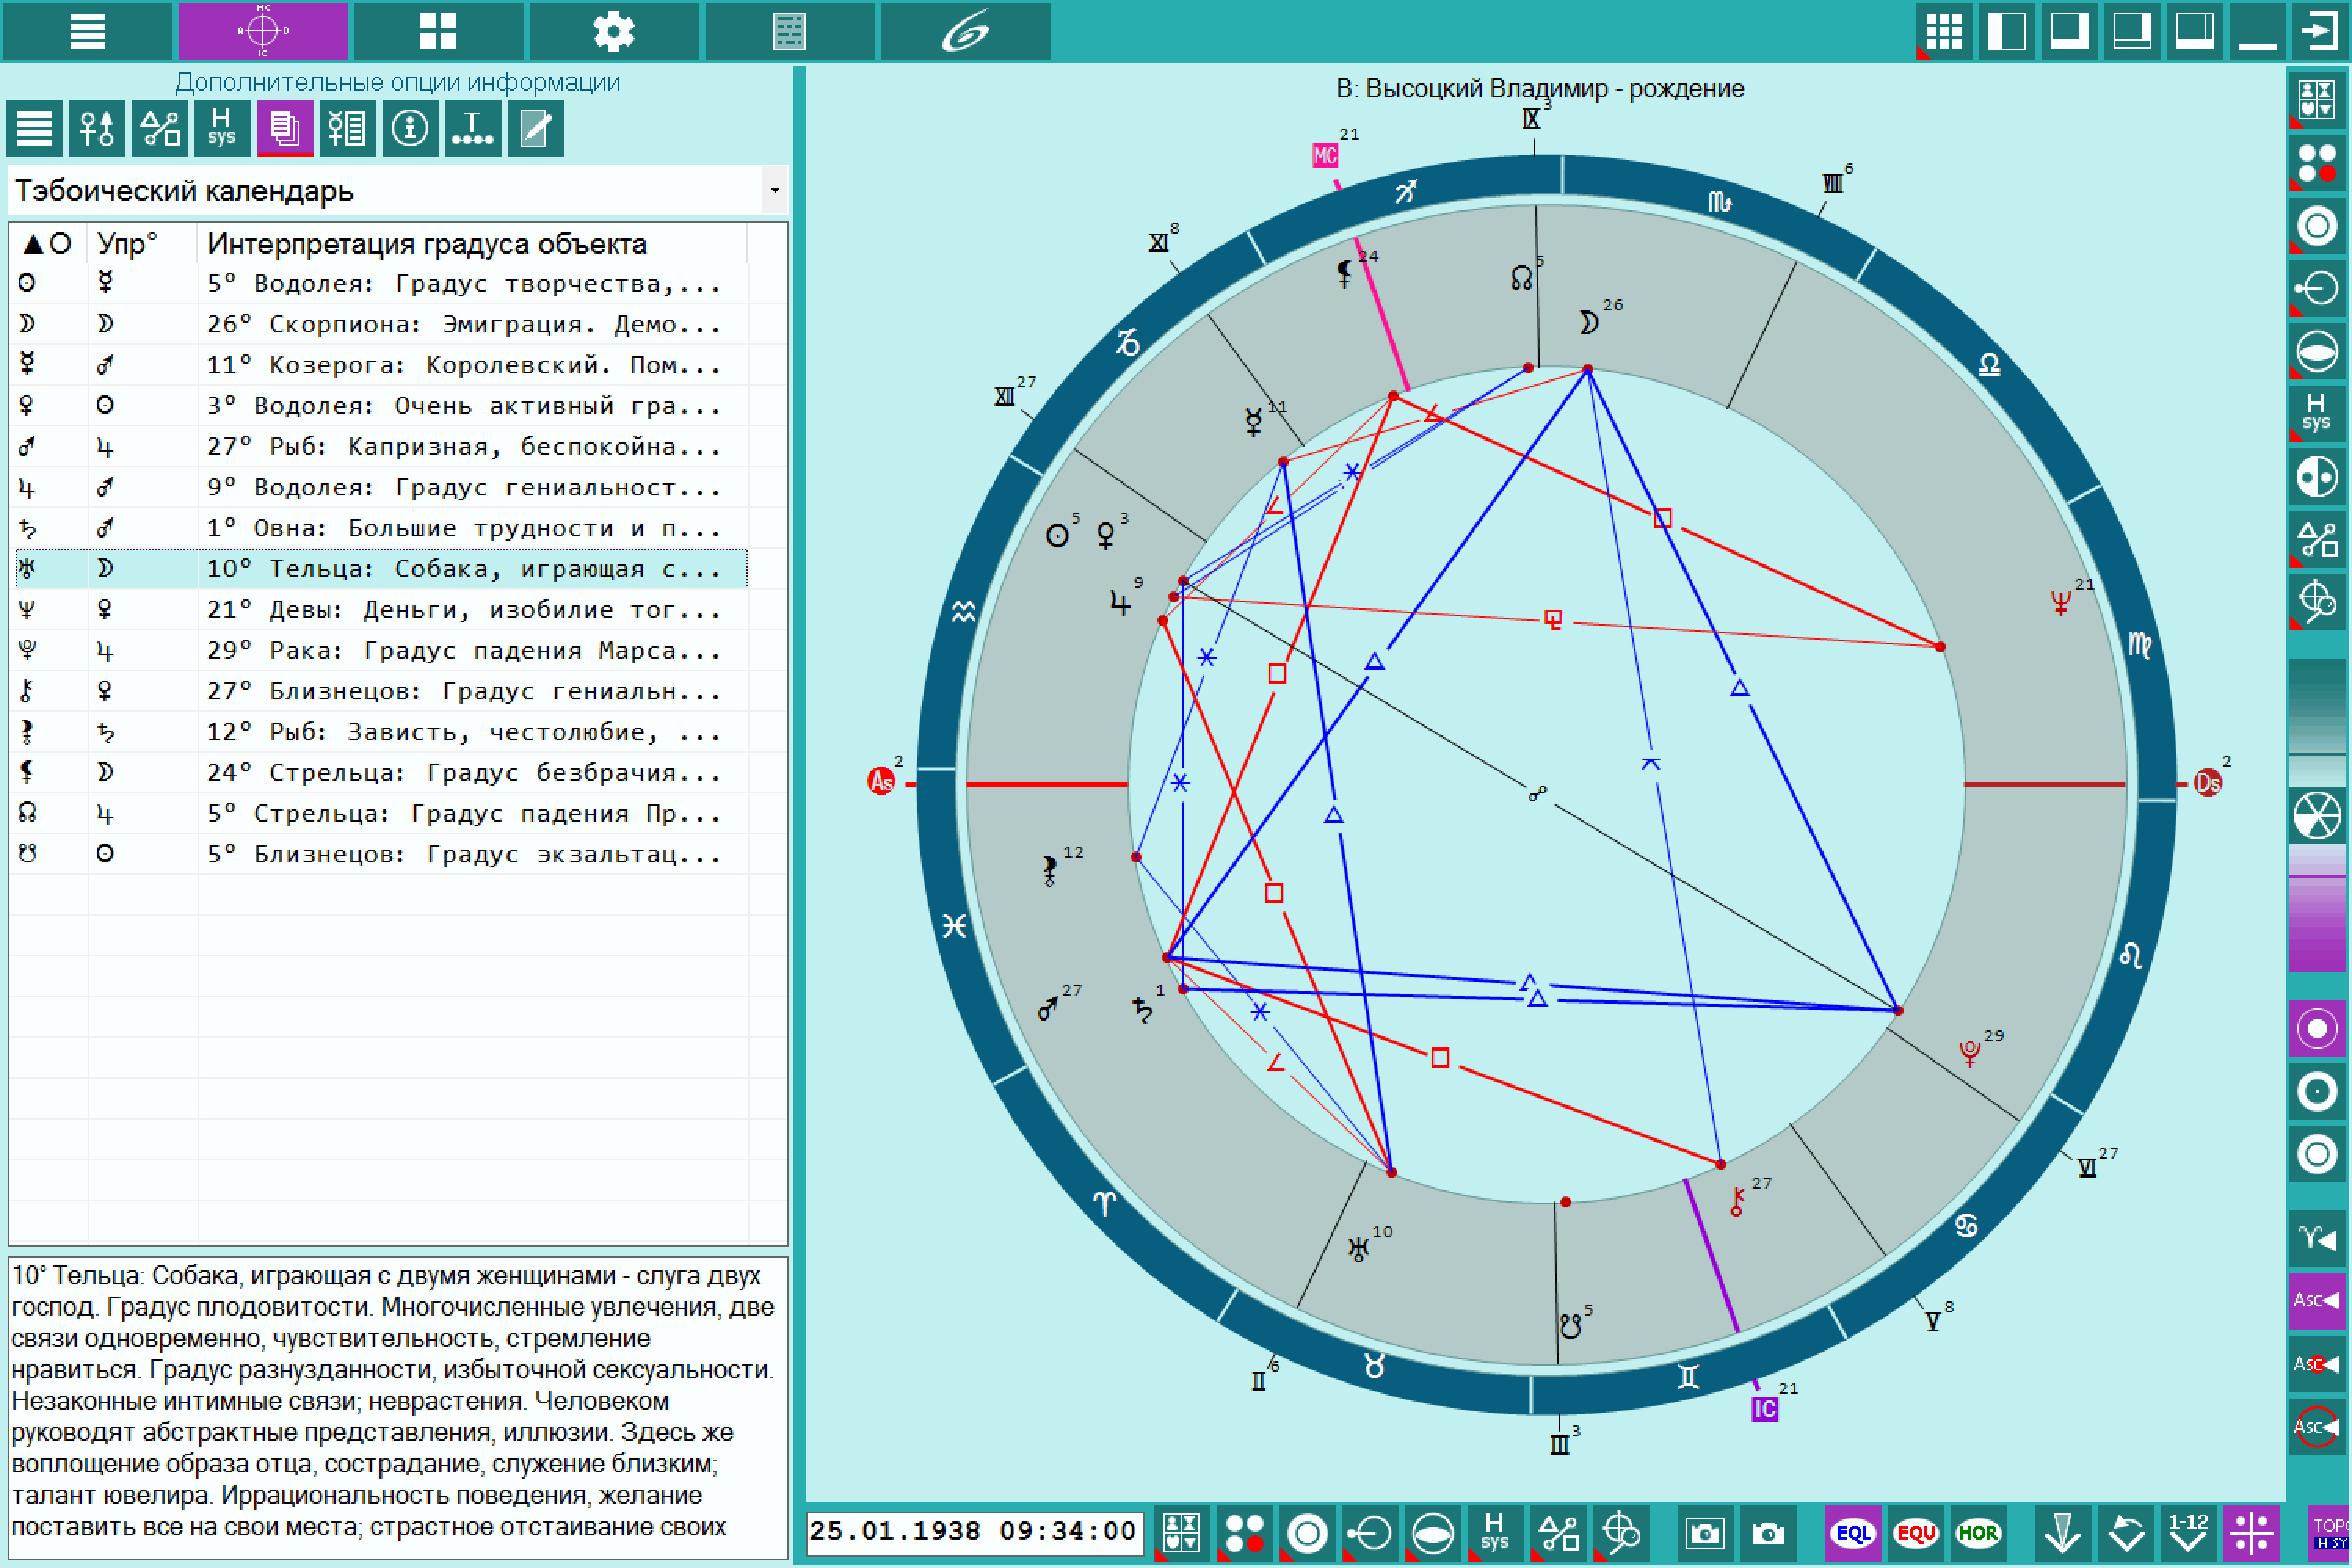
| Zodiac degrees for the current chart can be interpreted by a variety of data sources. |
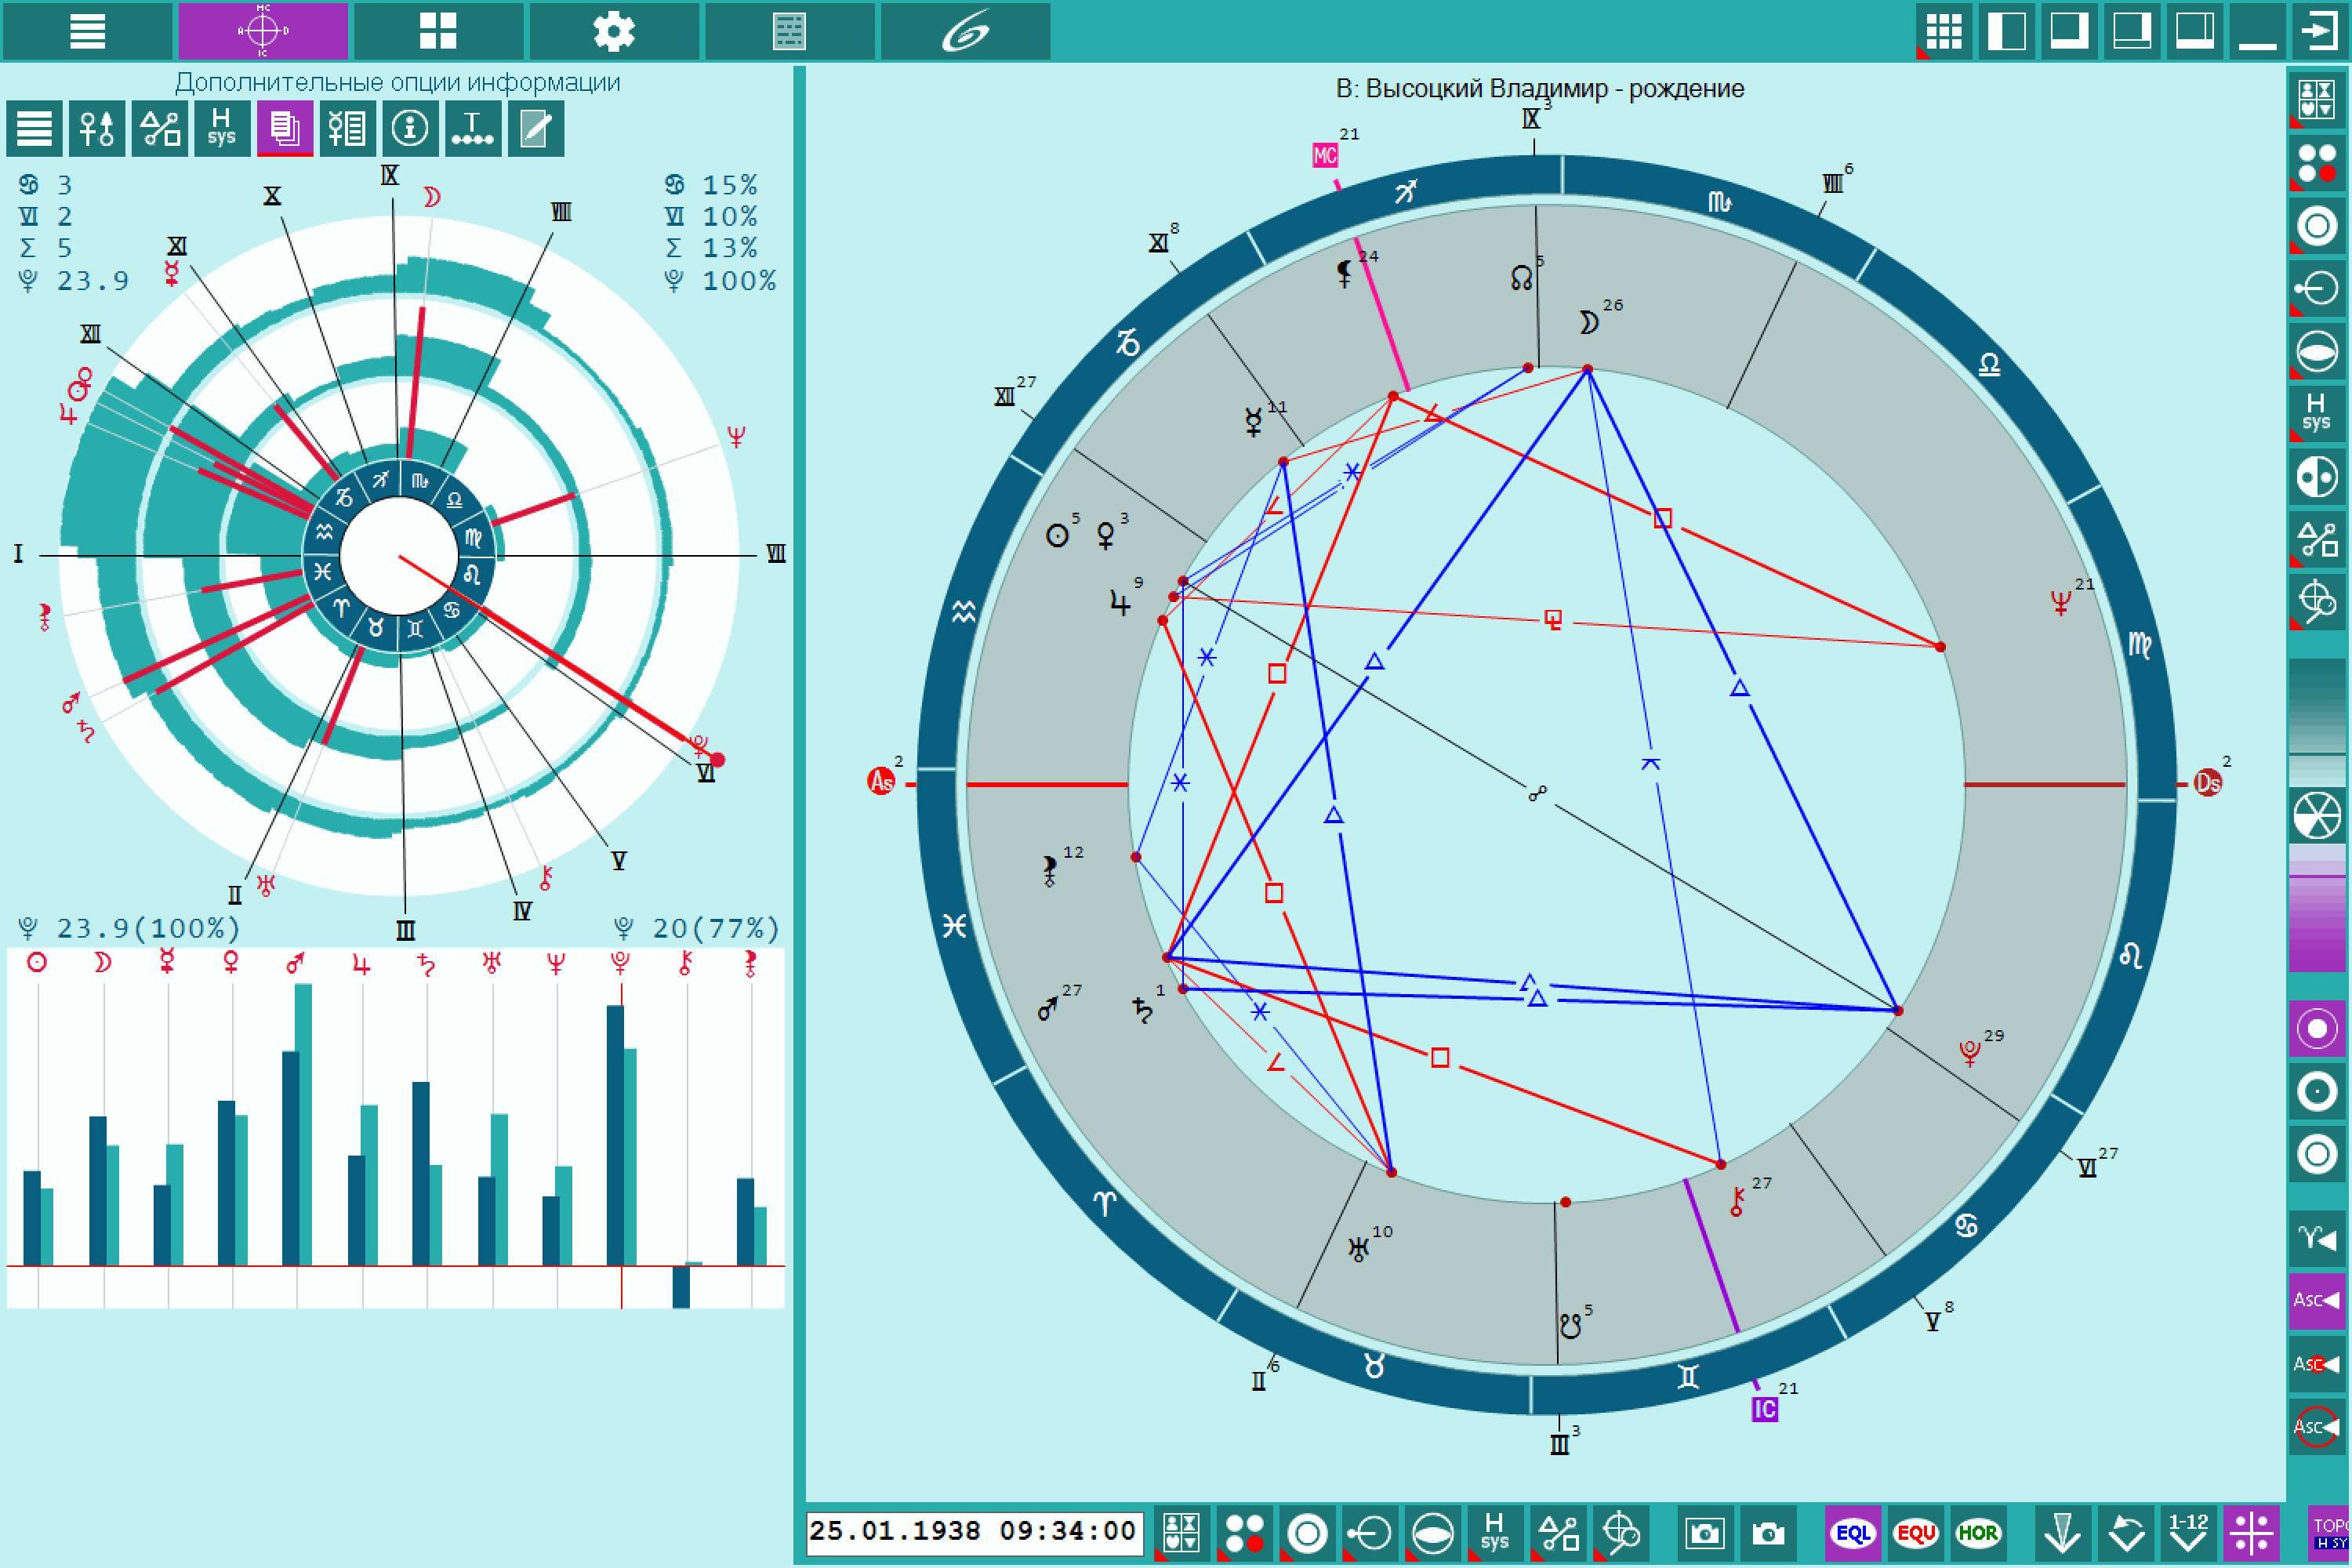
| The aphetic analysis of charts will be available if 'Analyzer of a natal chart' module is purchased. At the same time the querent’s strengths and weaknesses will be available for assessments in terms of strength of the planets, signs and houses, both in absolute terms and relative to the chart objects |
|
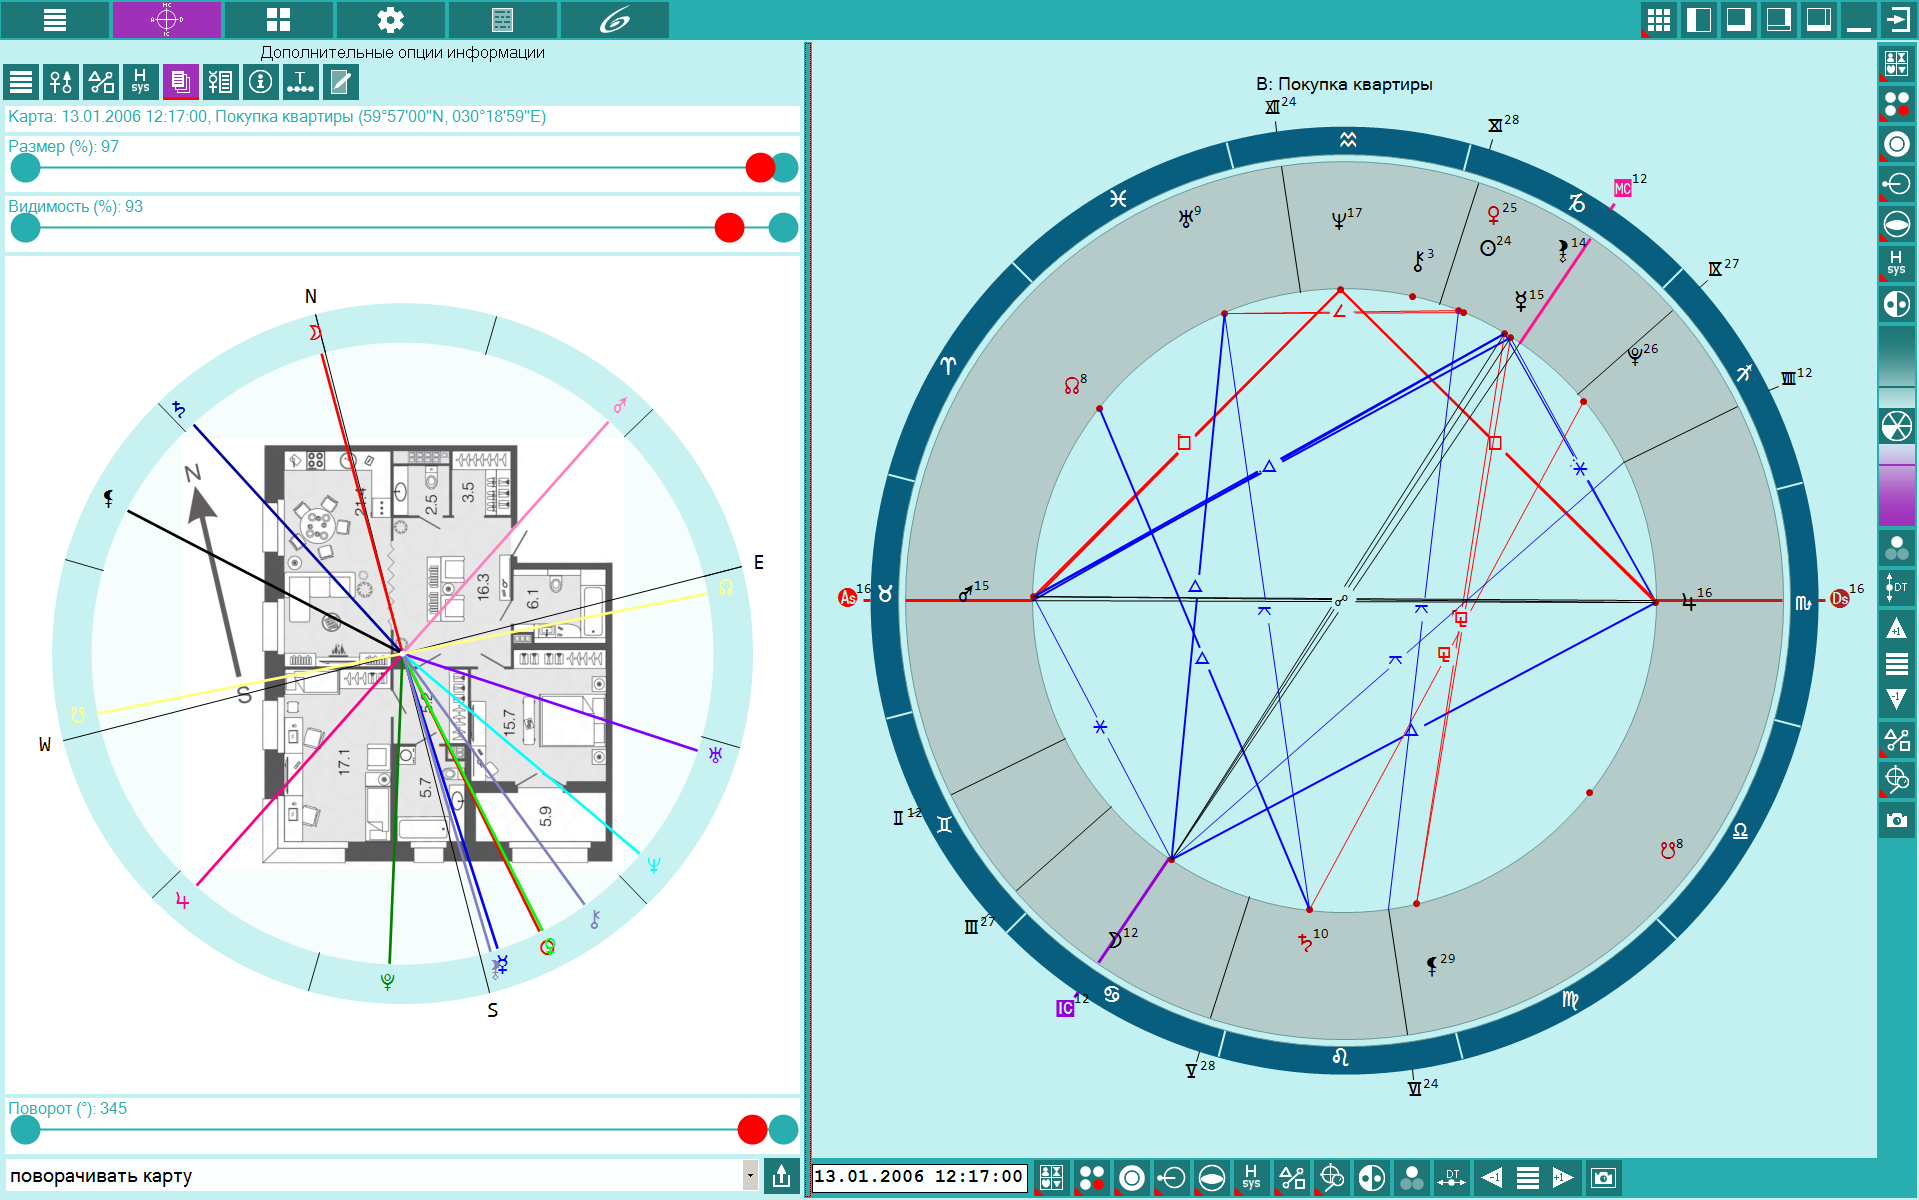
(module Charts++) LocalSpace Map. The LocalSpace map is available in the "Additional Information Options" mode. The program interface allows you to upload a picture, overlay it on a local space map (LocalSpace) and orient it to the cardinal points. |
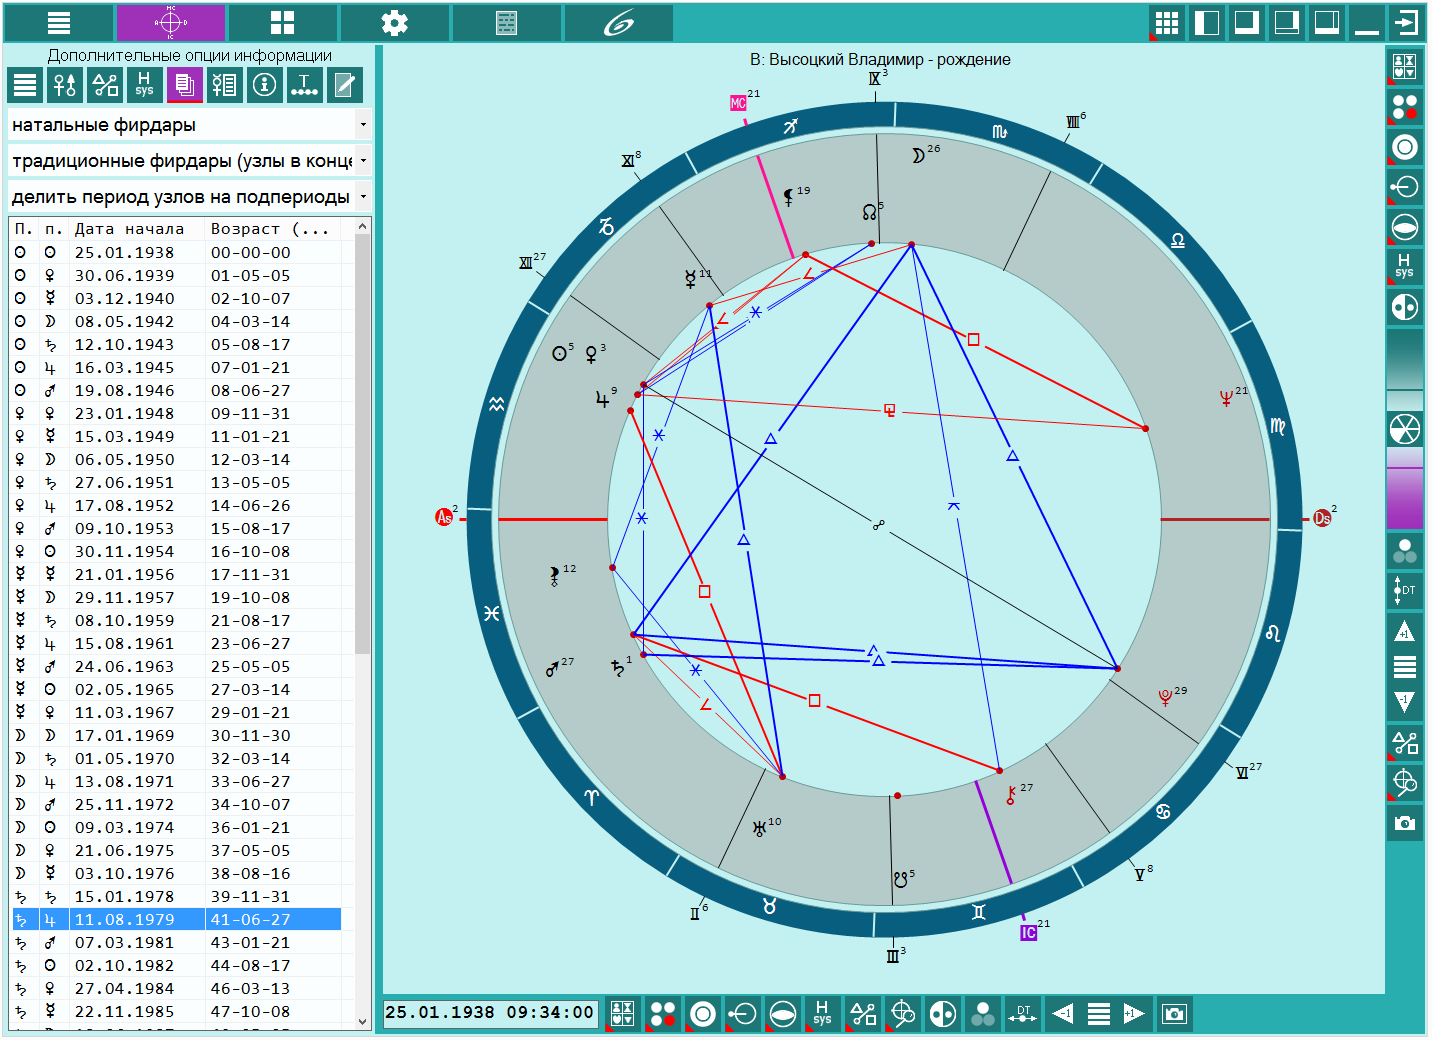
| Allows you to determine the date-time of firdars and small firdars of various traditions. Firdars are planetary periods used in predictive technology. Firdar - This is a 75-year cycle, ruled by nine objects from the Sun to Saturn and the lunar nodes (Rahu and Ketu). Type of firdars:
|
|
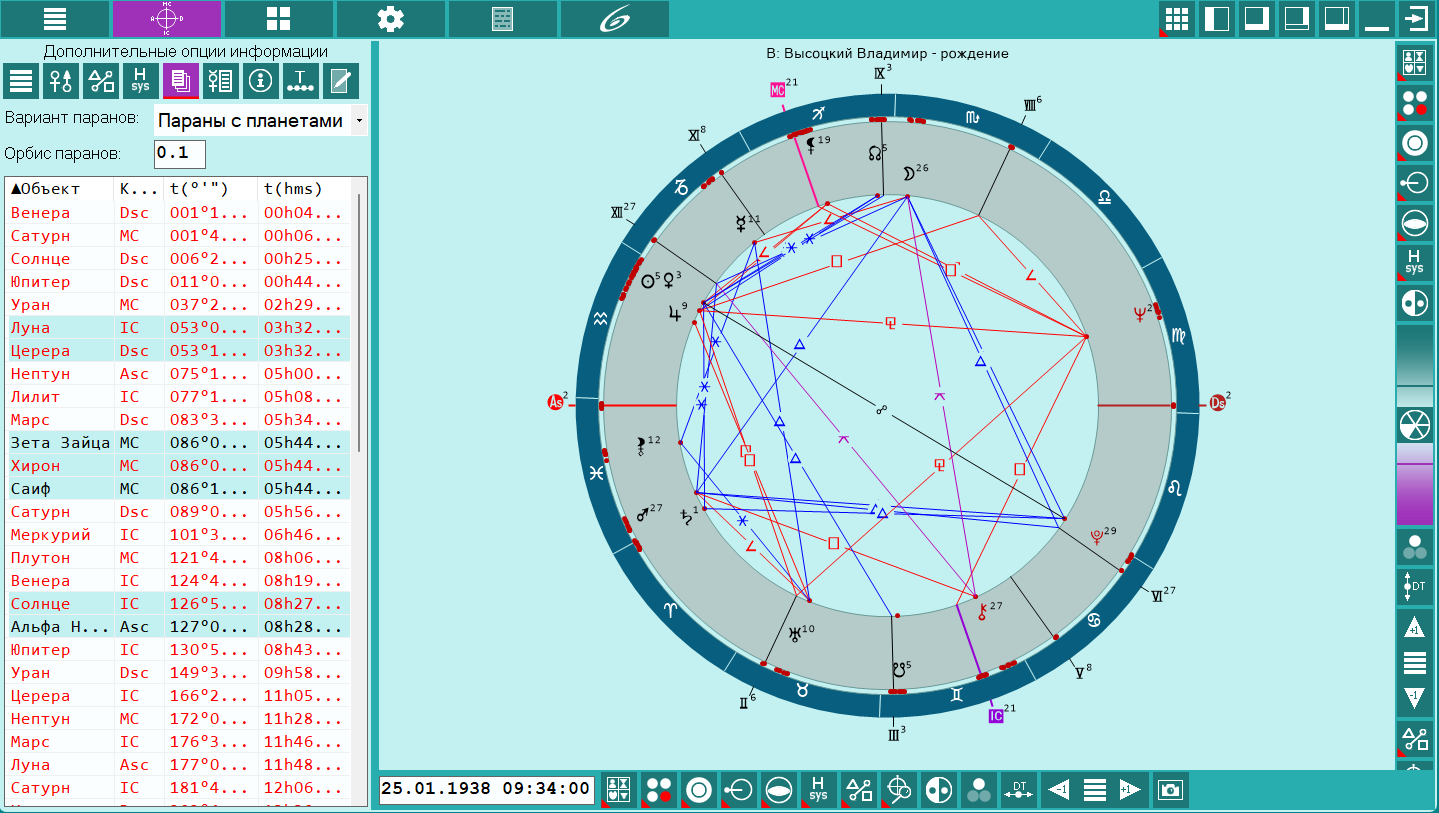
List of parans. From the multifunctional panel in the "Additional information options" menu, a list of parans opens. Paranas are both ascending and culminating objects, both special (stars, asteroids, etc.) and planets, planetoids, etc. At some point in time, these objects may simultaneously appear on Asc, Dsc, IC or MC. This doesn't mean that they should all be on Asc or IC only. It is important that at the same time, they are on these corner lines. These will be the parans. Important! It should be taken into account that special objects that are included in the "Display on Maps" tool play a role in the formation of this list. If none of the special groups of objects is included, then only planet parans are displayed in the list. |

| Interpretation of chart objects. You can use both sources of interpretation of chart objects supplied with the program, and user-created (downloadable) files. Integrated interpretation sources take into account the types of charts (natal or event) and allow you to use size of interpretation text in the form of words, phrases or sentences |
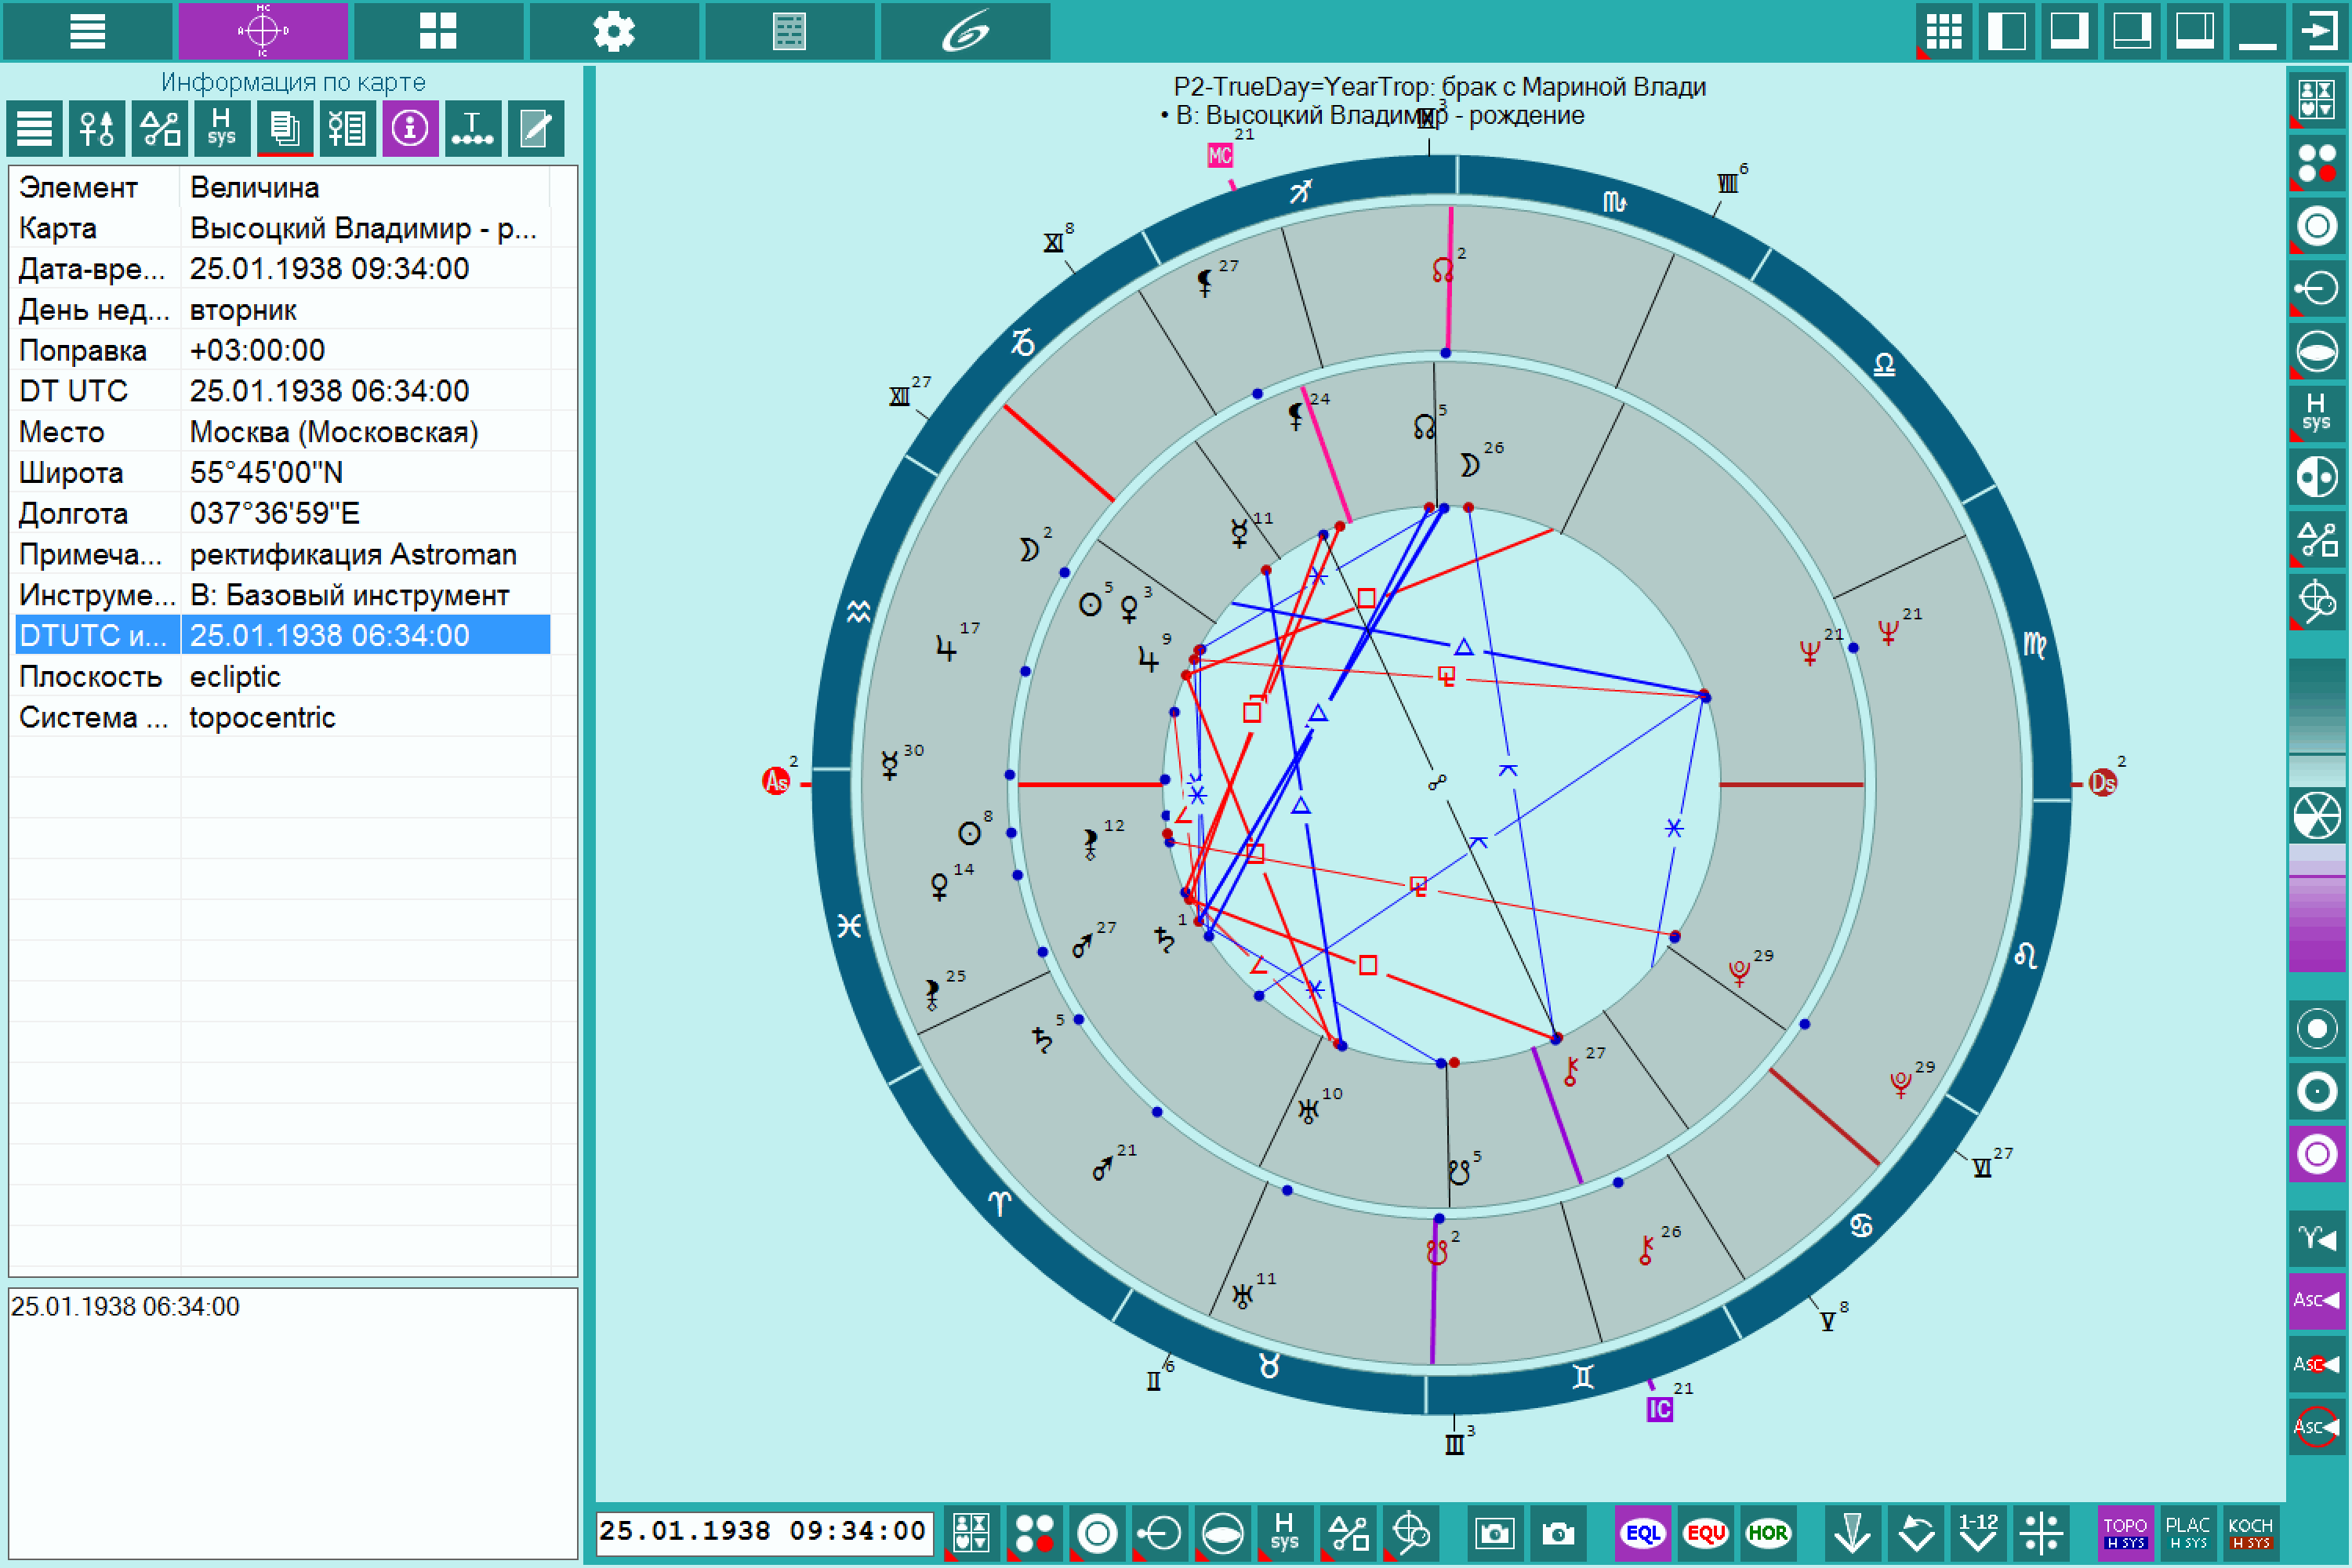
| Information on a chart. You can obtain additional information on a chart here For example, given time of astrological instrument |
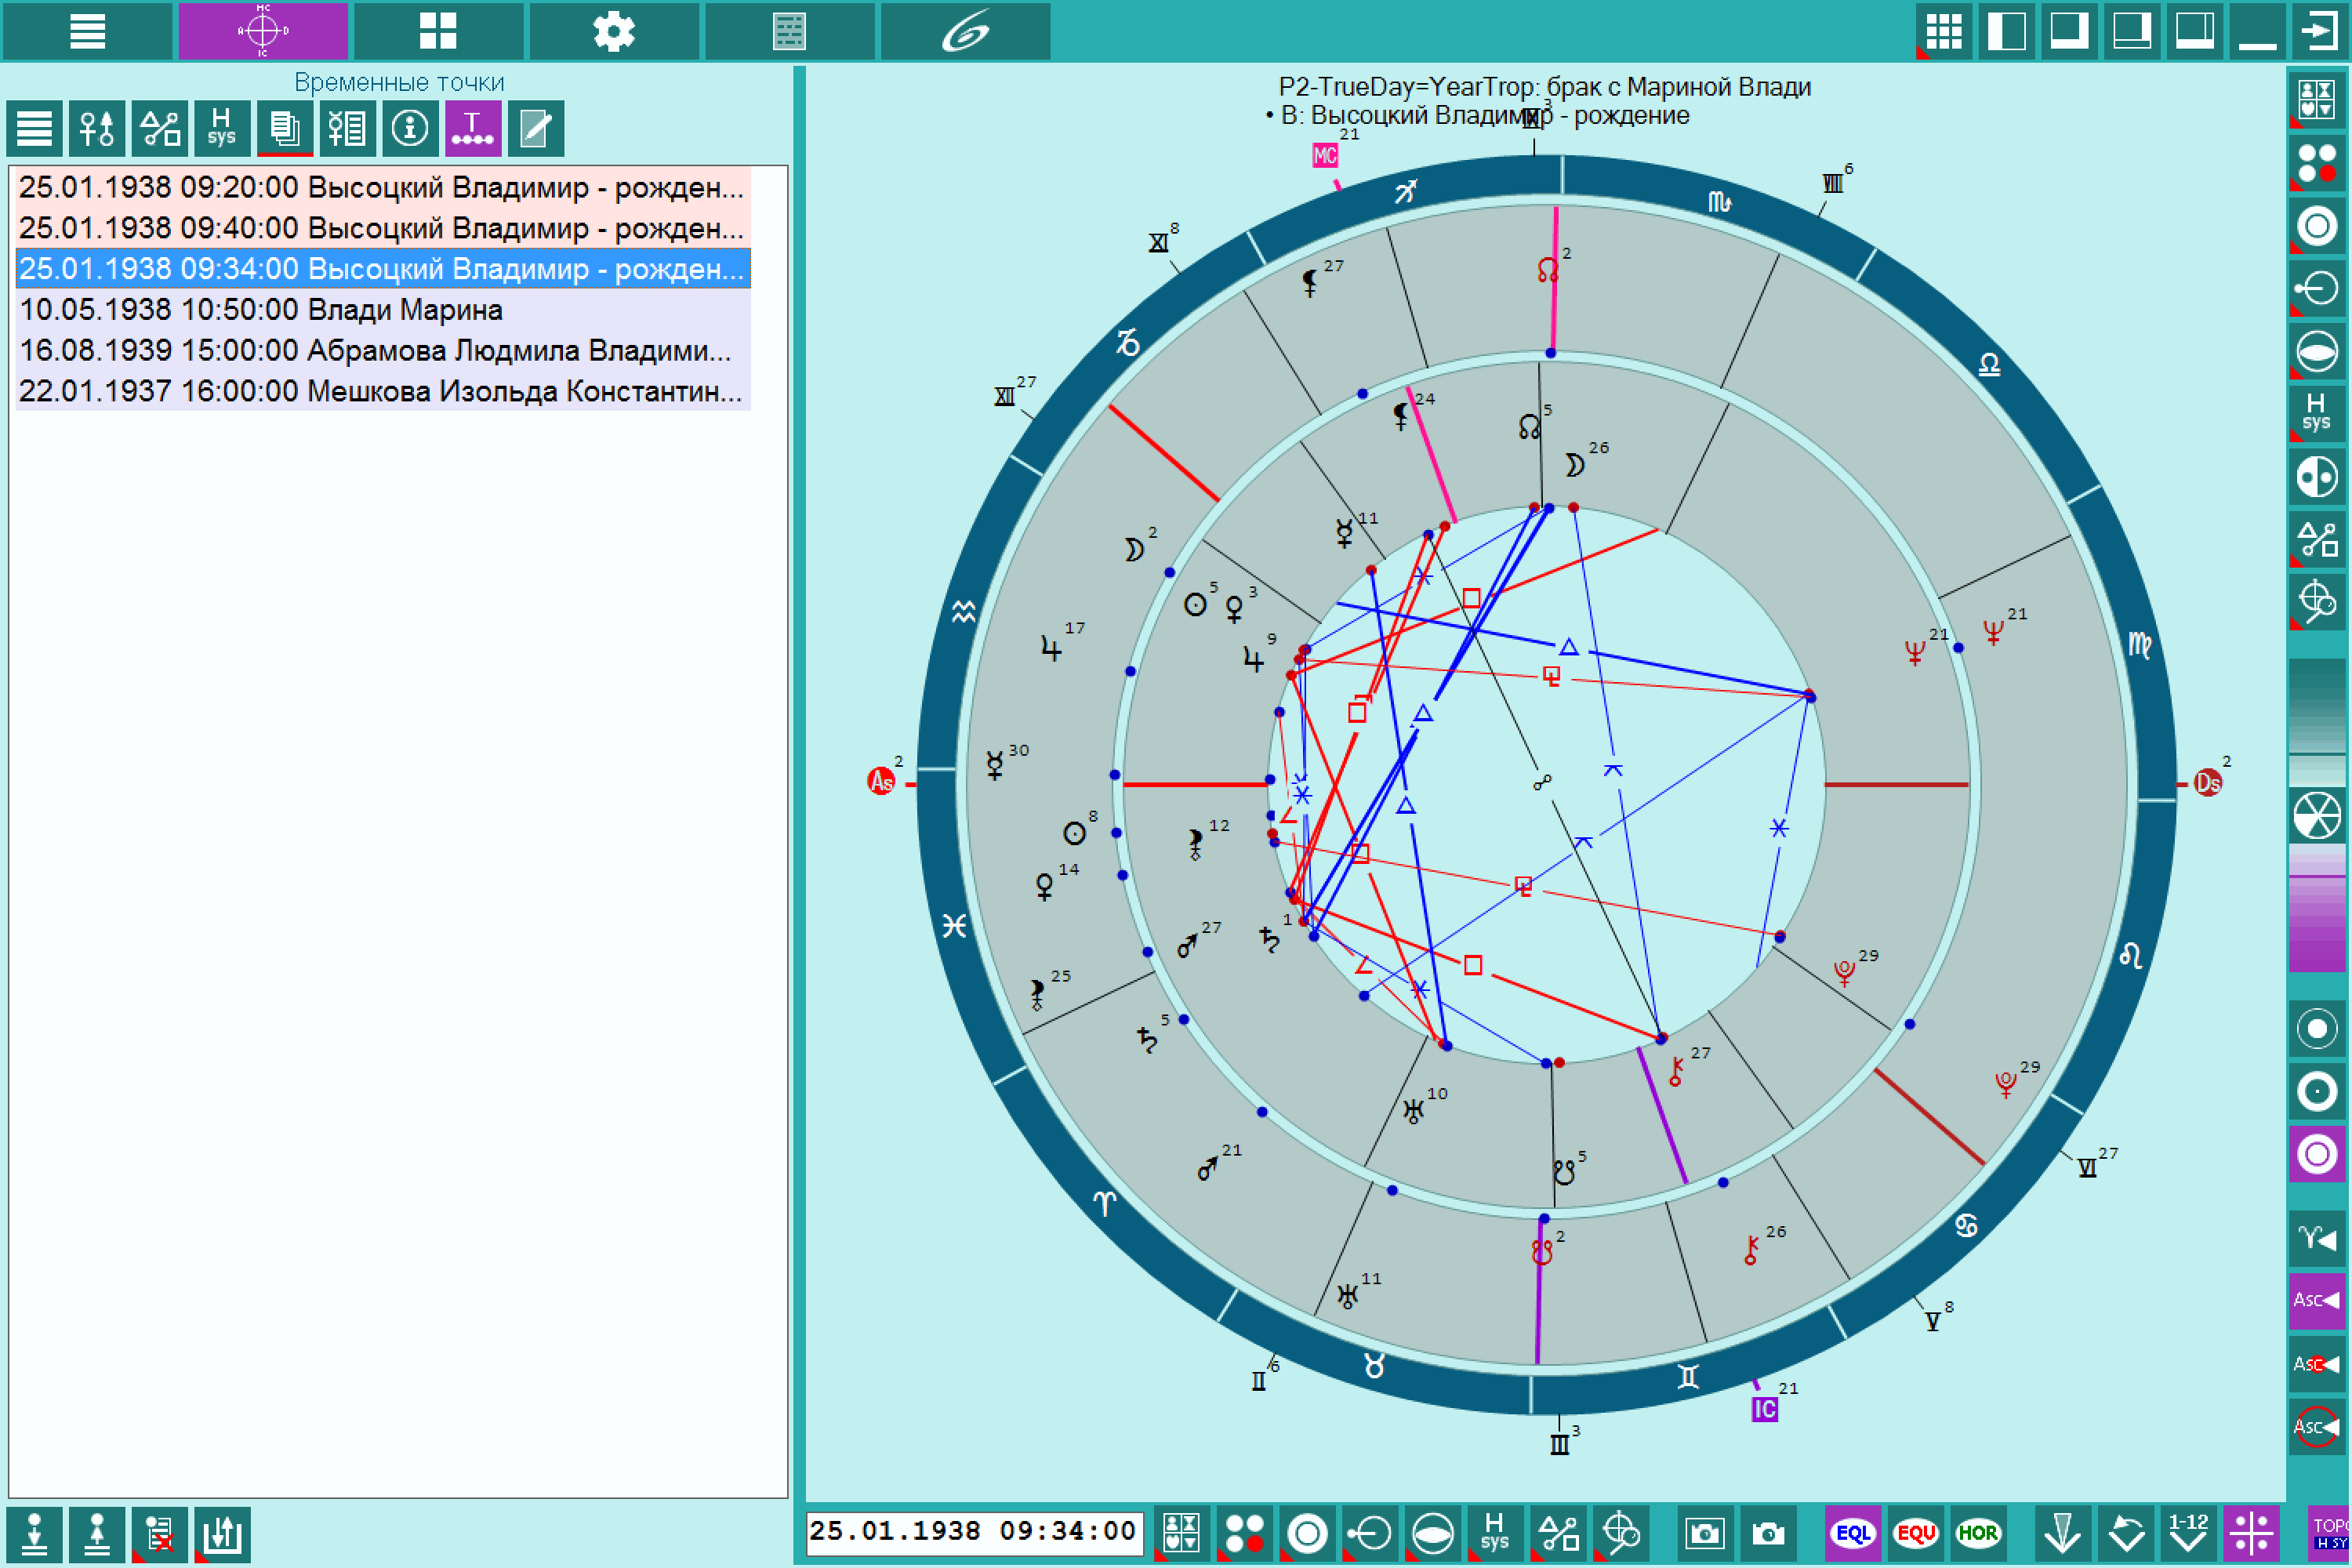
| Time points. Time points mechanism allows you to quickly set the time of the chart or event. Depending on the setting, time points may vary in color depending on what chart the time was received from |

| Notepad is designed for annotations and notes in the course of astrologer's work with the astrological program |
| The chart dynamics tool allows to change the chart date/time discrete and in acceleration mode |

| (module Charts++) The chart dynamics tool in the event search mode allows to find easily different astrological moments, not only for transit but for all astrological instruments, excluding returns |
| (module Charts++) The chart dynamics tool in the search mode of angular distance allows to find easily the time of aspect's occurrence. Only those aspects are displayed which are on |
| (module Charts++) Tools "Changing the chart for the period of time" to change the time the chart gently in the specified time range. This option can be set 2 periods:
|
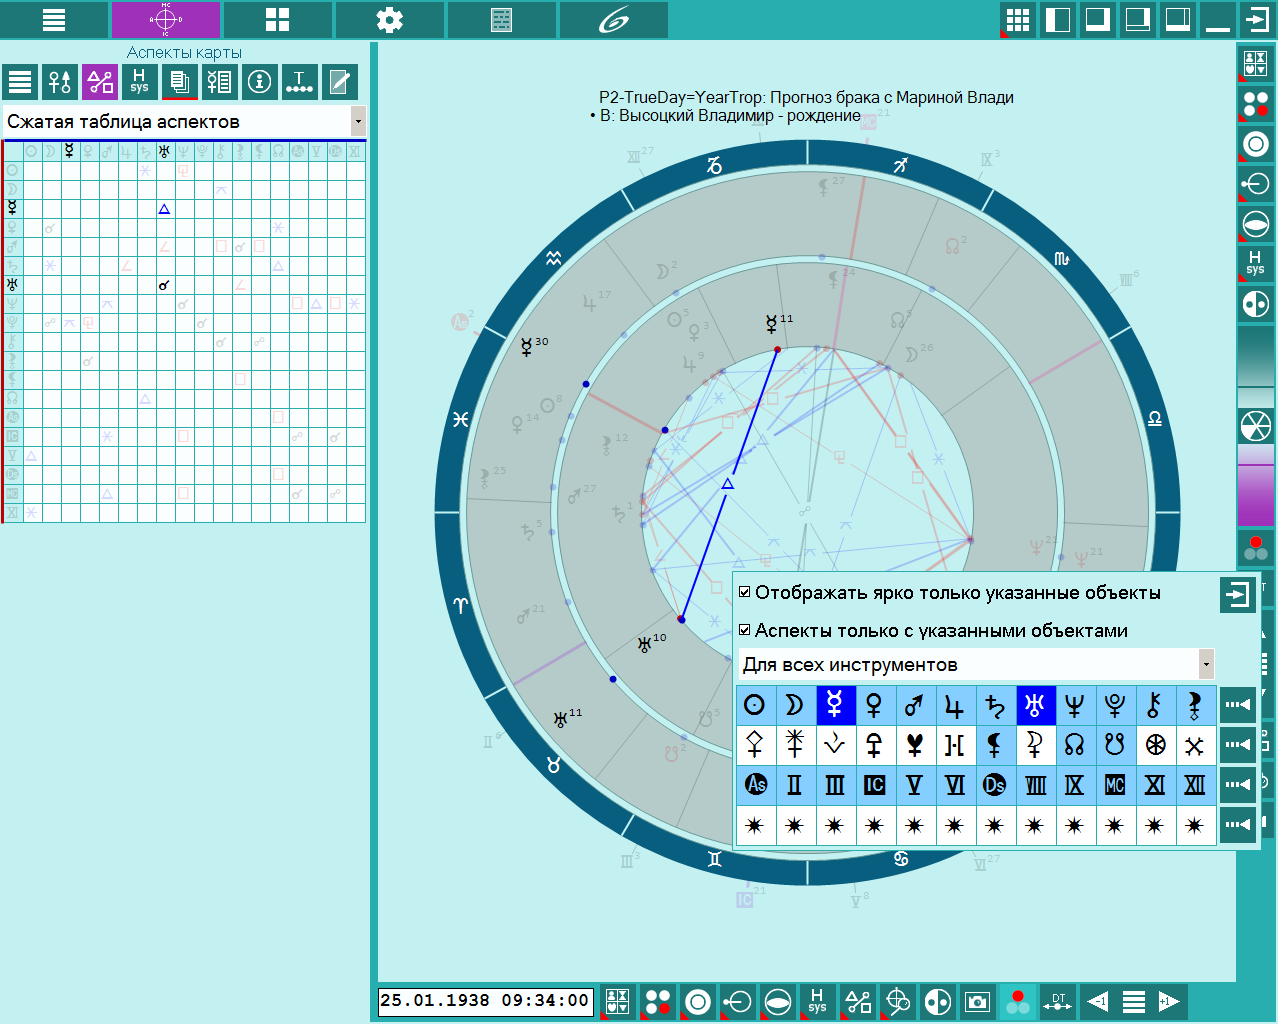
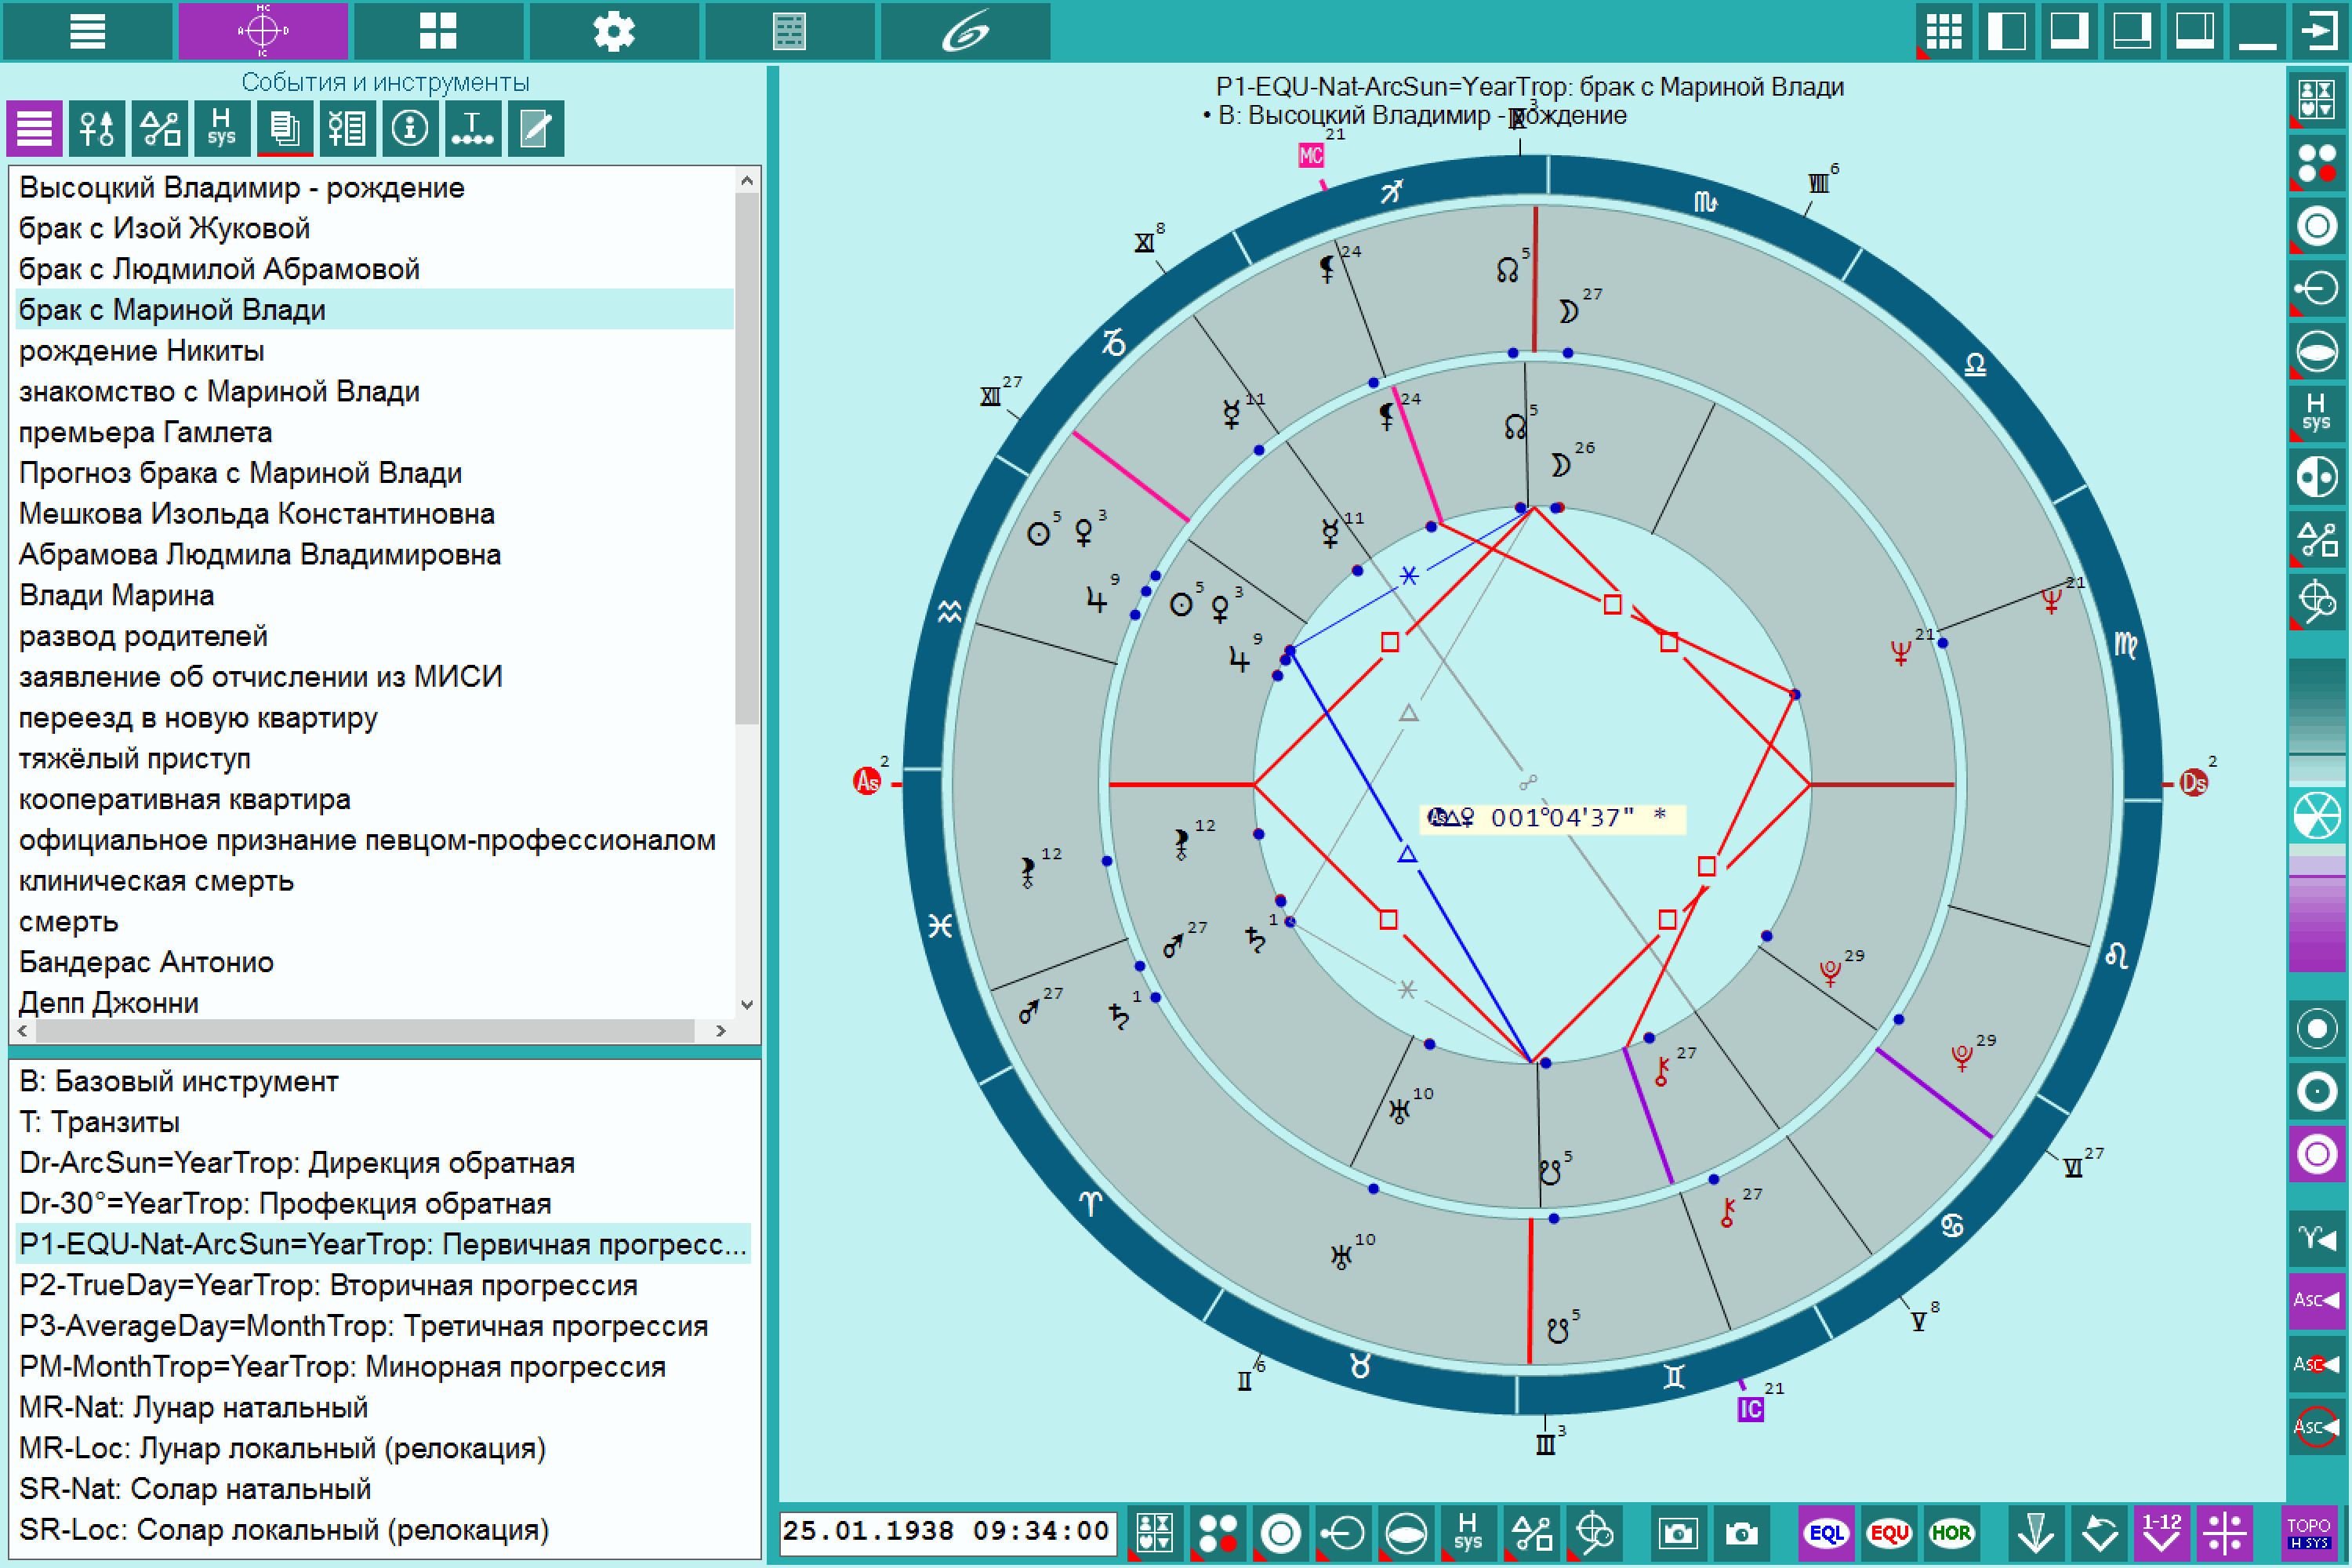
| (module Charts++) The tool "Select the chart object" allows you to select objects on the charts given astrologer, and the rest discolor objects. It allows brightness allocate these objects on charts, focusing astrologer. |
| (module Charts++) Thematic aspects - aspects on a given theme of a house. The mechanism offloads a chart and greatly facilitates its perception by an astrologer since it highlights aspects related to the theme of a given house and displays the others in gray. You just should specify in the settings which category of objects will be involved and the program will highlight the thematic aspects depending on the theme of event and position of the chart objects |

| On/off chart objects. It allows you to quickly turn on/off or switch the entire group of objects. The chart objects are not only displayed, but also participate in cross and full aspects (not typical for routine work) |

| (module Charts++) Real position of the angular planet allows to see the real position of the planets in the houses near the angular cusps. For example, in ecliptic coordinates and taking into account the Topocentric House system Saturn is situated in the 9th house, but its real position is in the 10th. In this case, its interpretation changes dramatically in the querent’s natal chart |
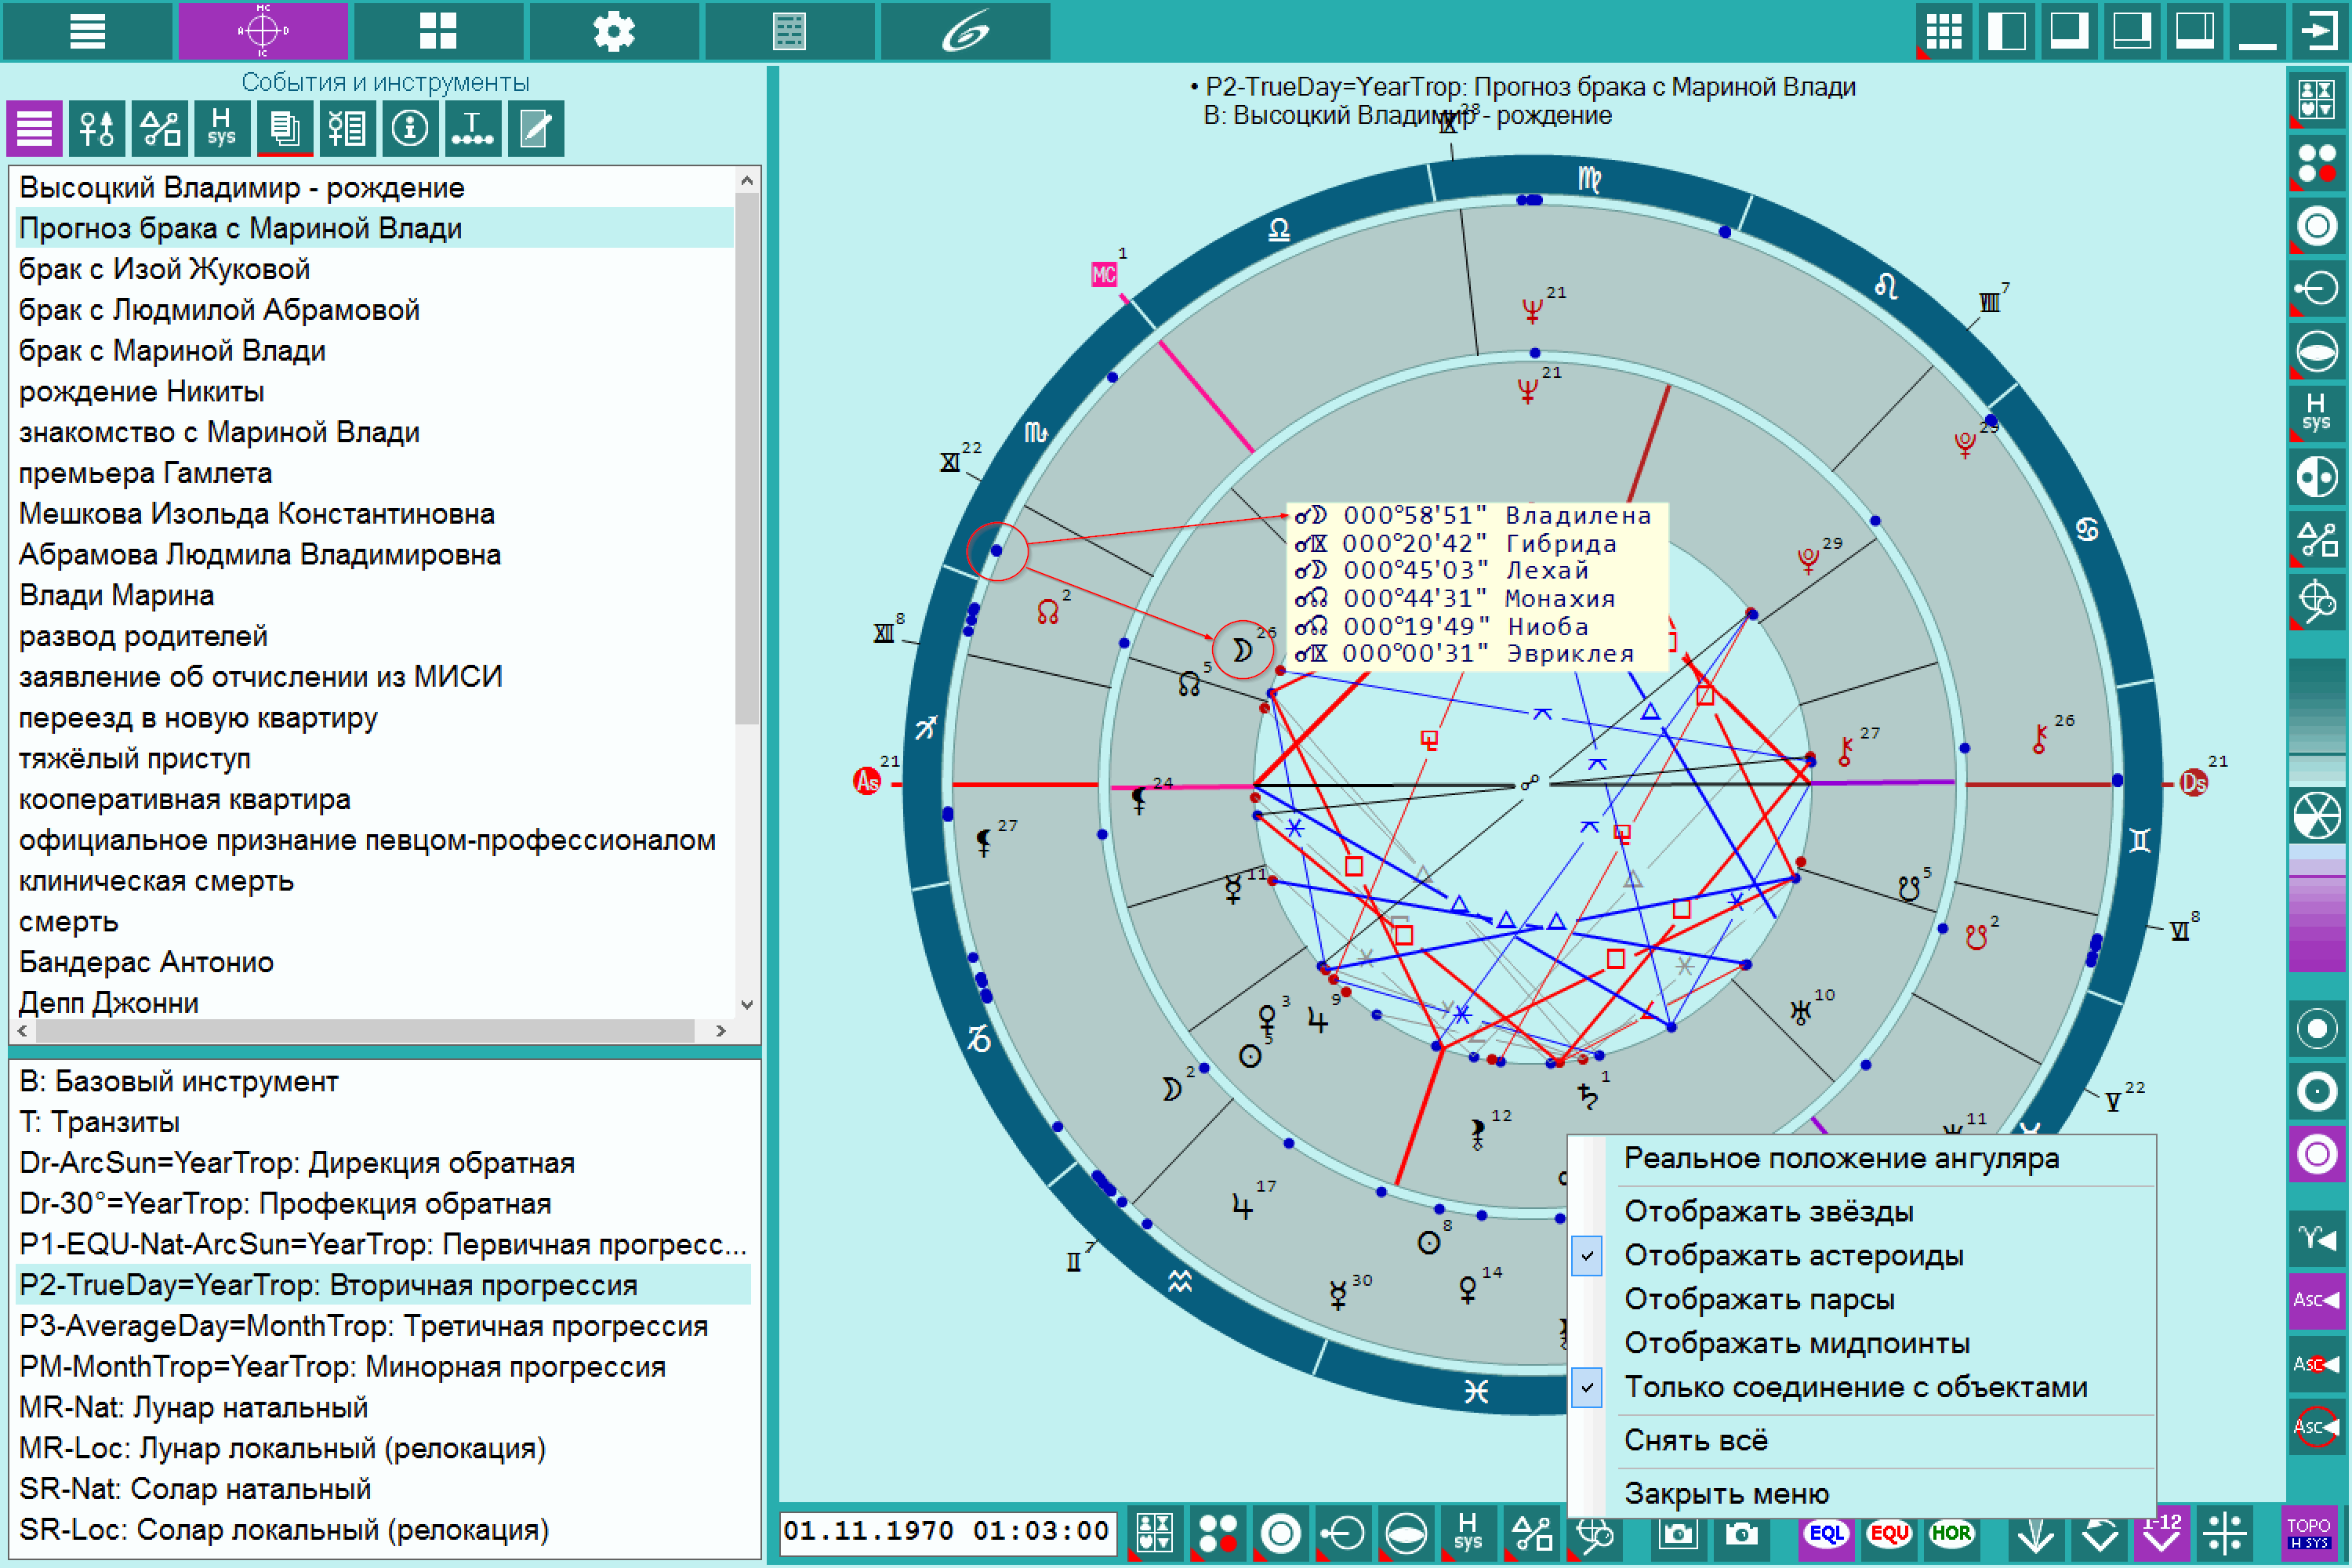
| Conjunction with stars, parses, midpoints, exotic objects, gems, planetary orbital elements, and medical astrology stars. In astrological programs Stars, Asteroids, Points, Gems and Exos you can prepare thematic sets of objects (stars, asteroids, pars, midpoints, exotic objects, stones, elements of the orbits of planets and stars of medical astrology) and then use them in Charts. A display feature should be taken into account: when displaying a double chart, asteroids are displayed only for the current (selected) chart (in the figure this is the event map), which are connected to the objects of the internal (natal) chart. Additionally, you can set the display only for connections to chart objects, which greatly simplifies the perception. You can only work with one view at a time (either stars, or asteroids, or points) |
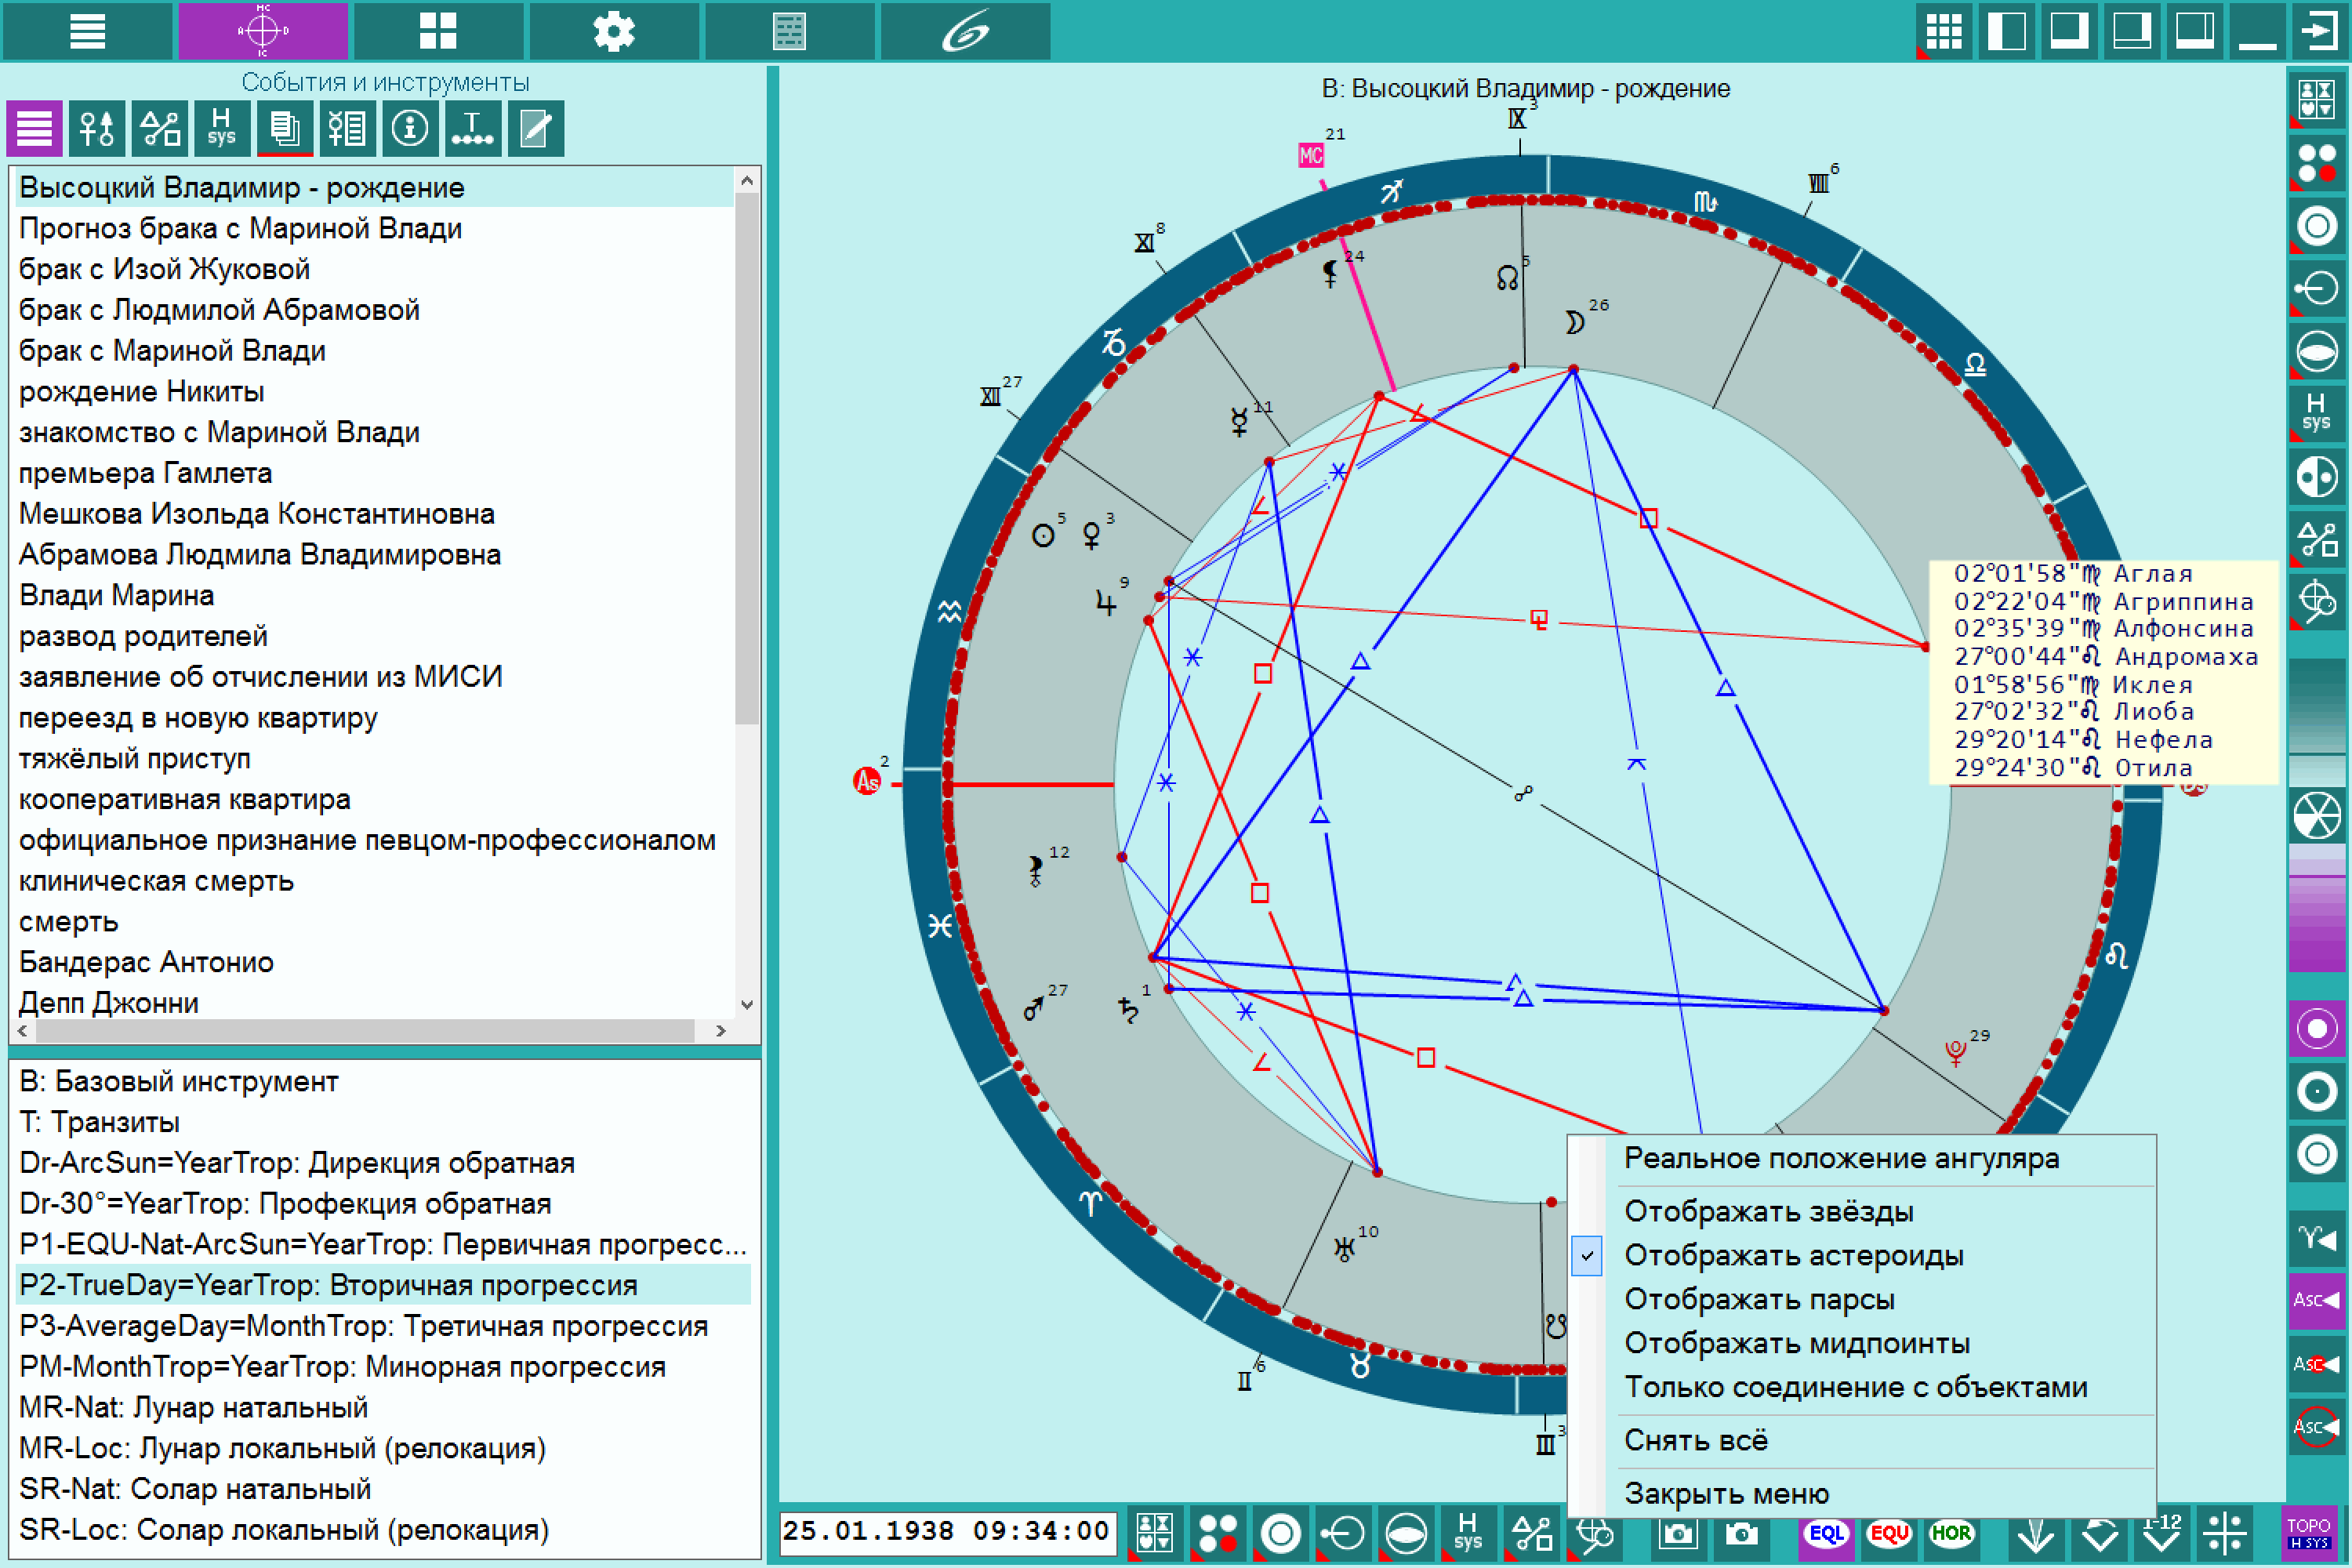
| When "Conjunction with the objects only" is unchecked the full list of asteroids (stars, Parts and midpoints) is displayed from a prepared list. And their position will depend on the current astrological tool |
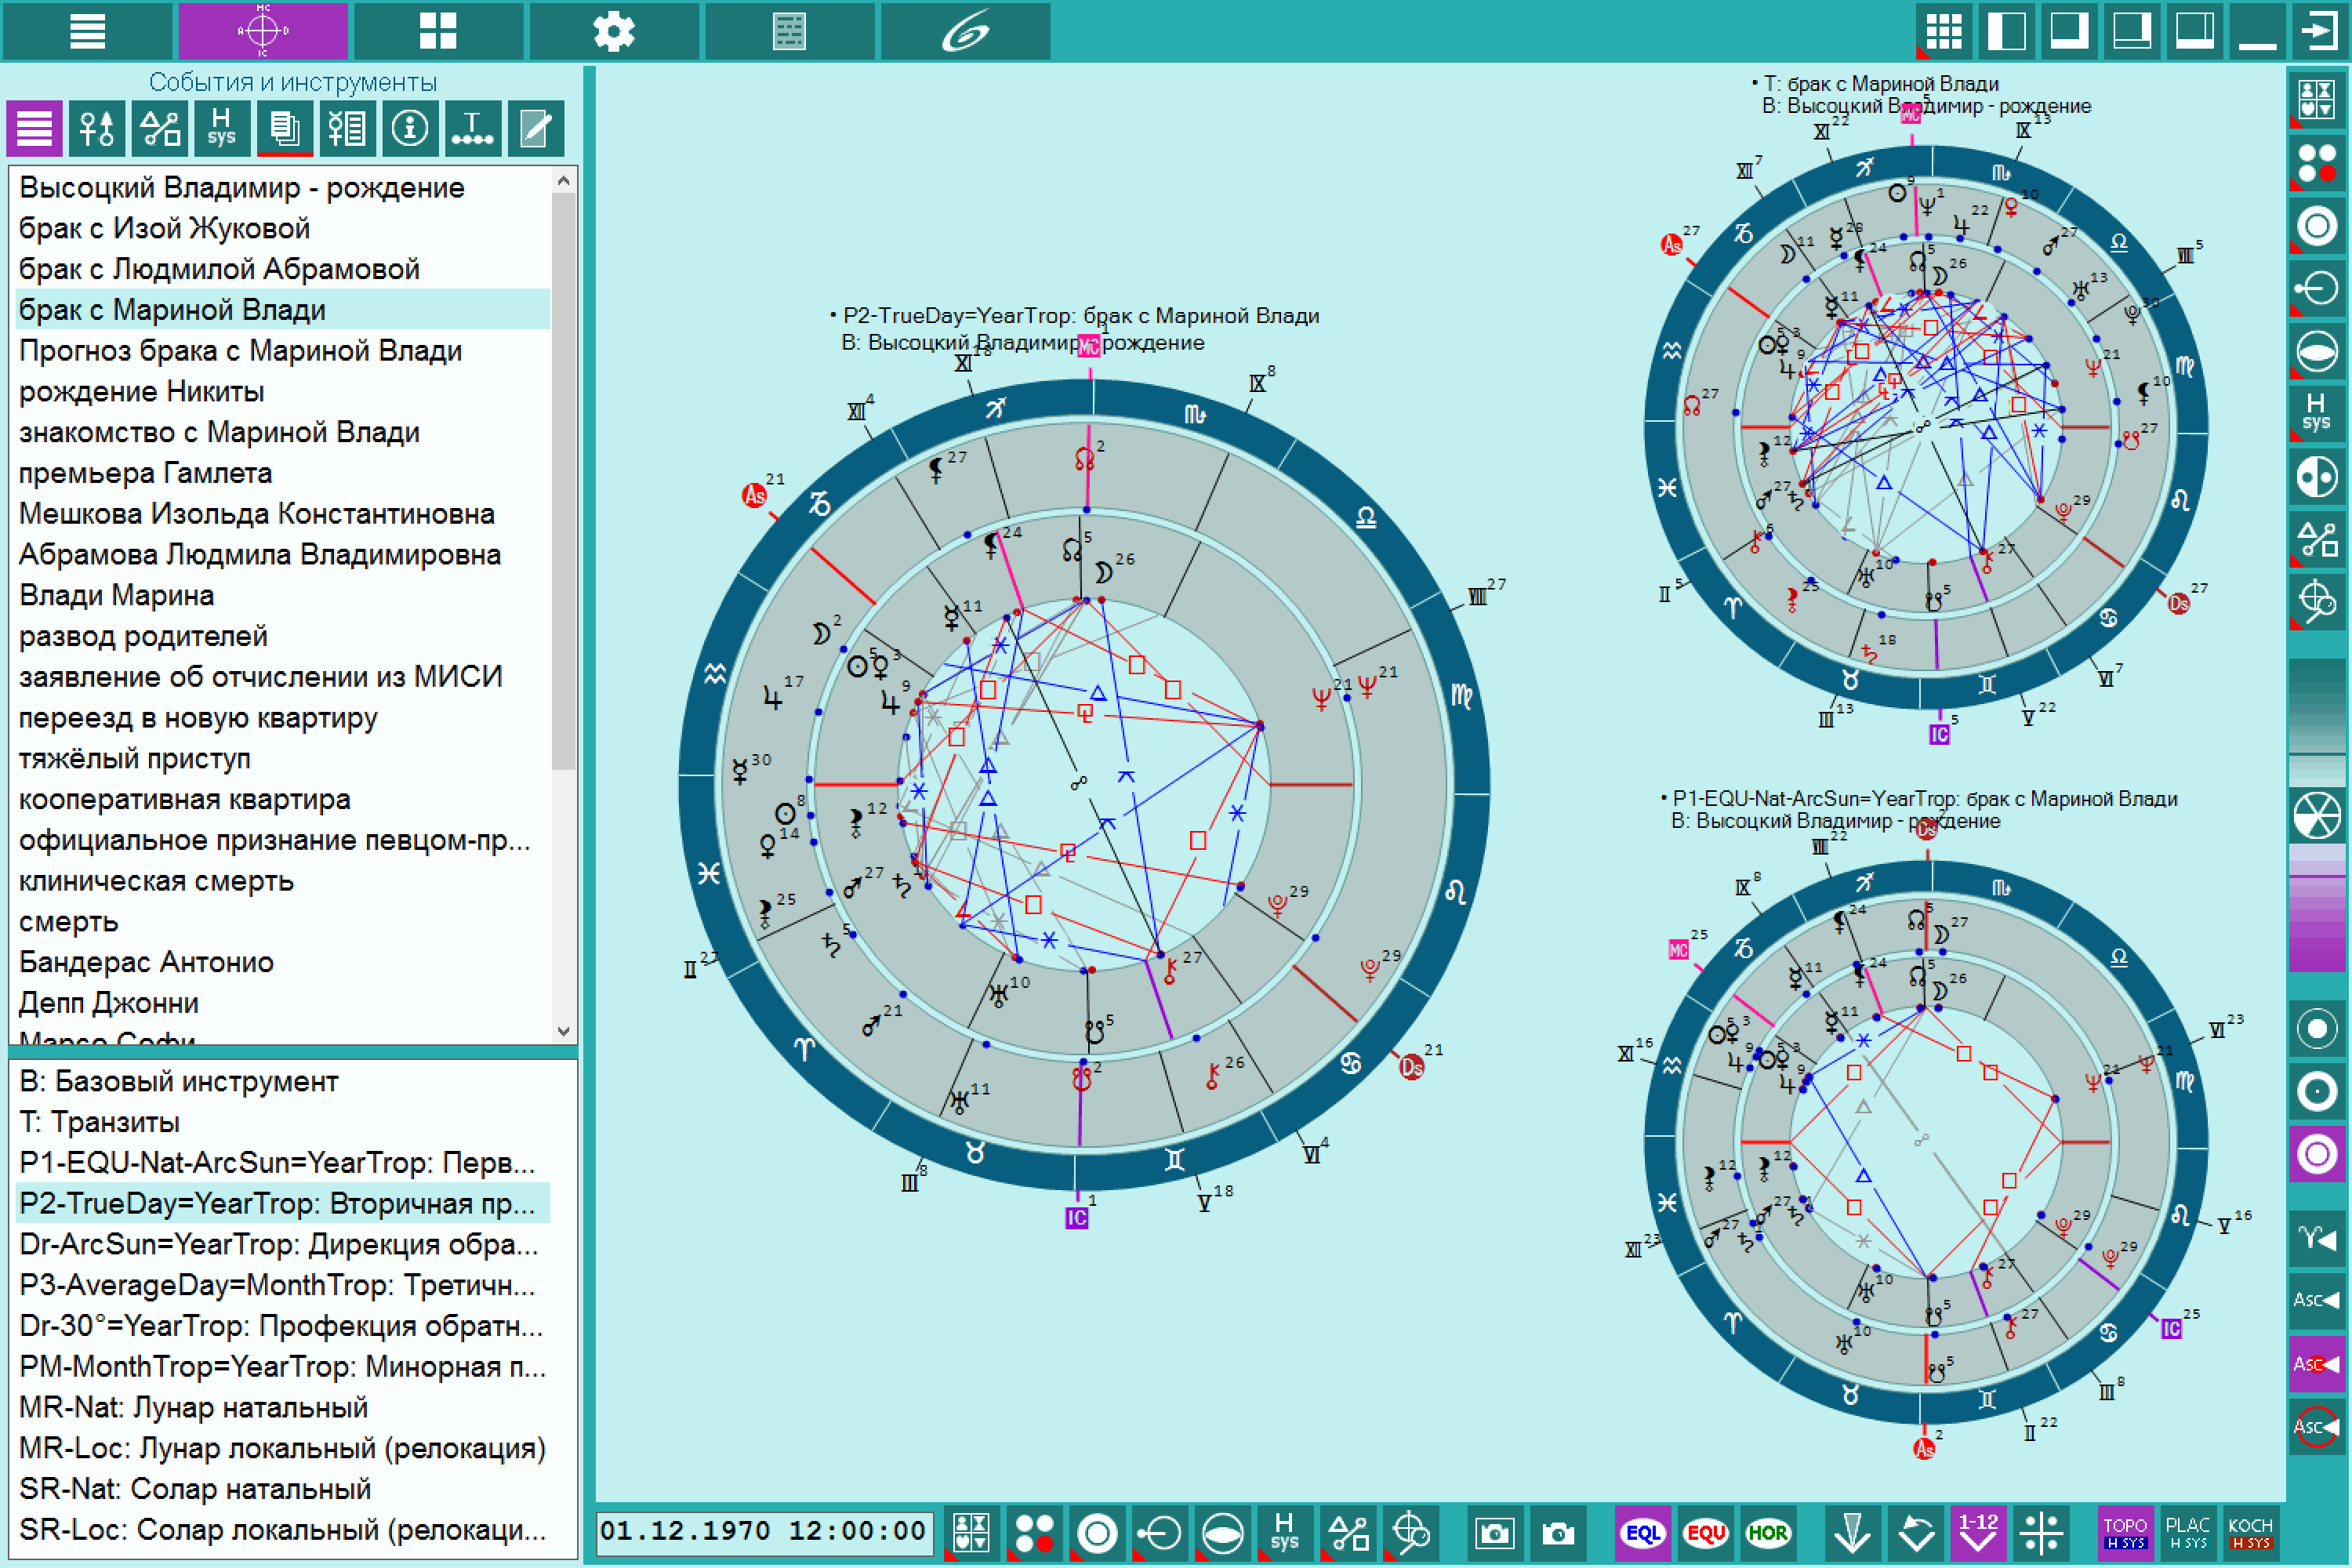
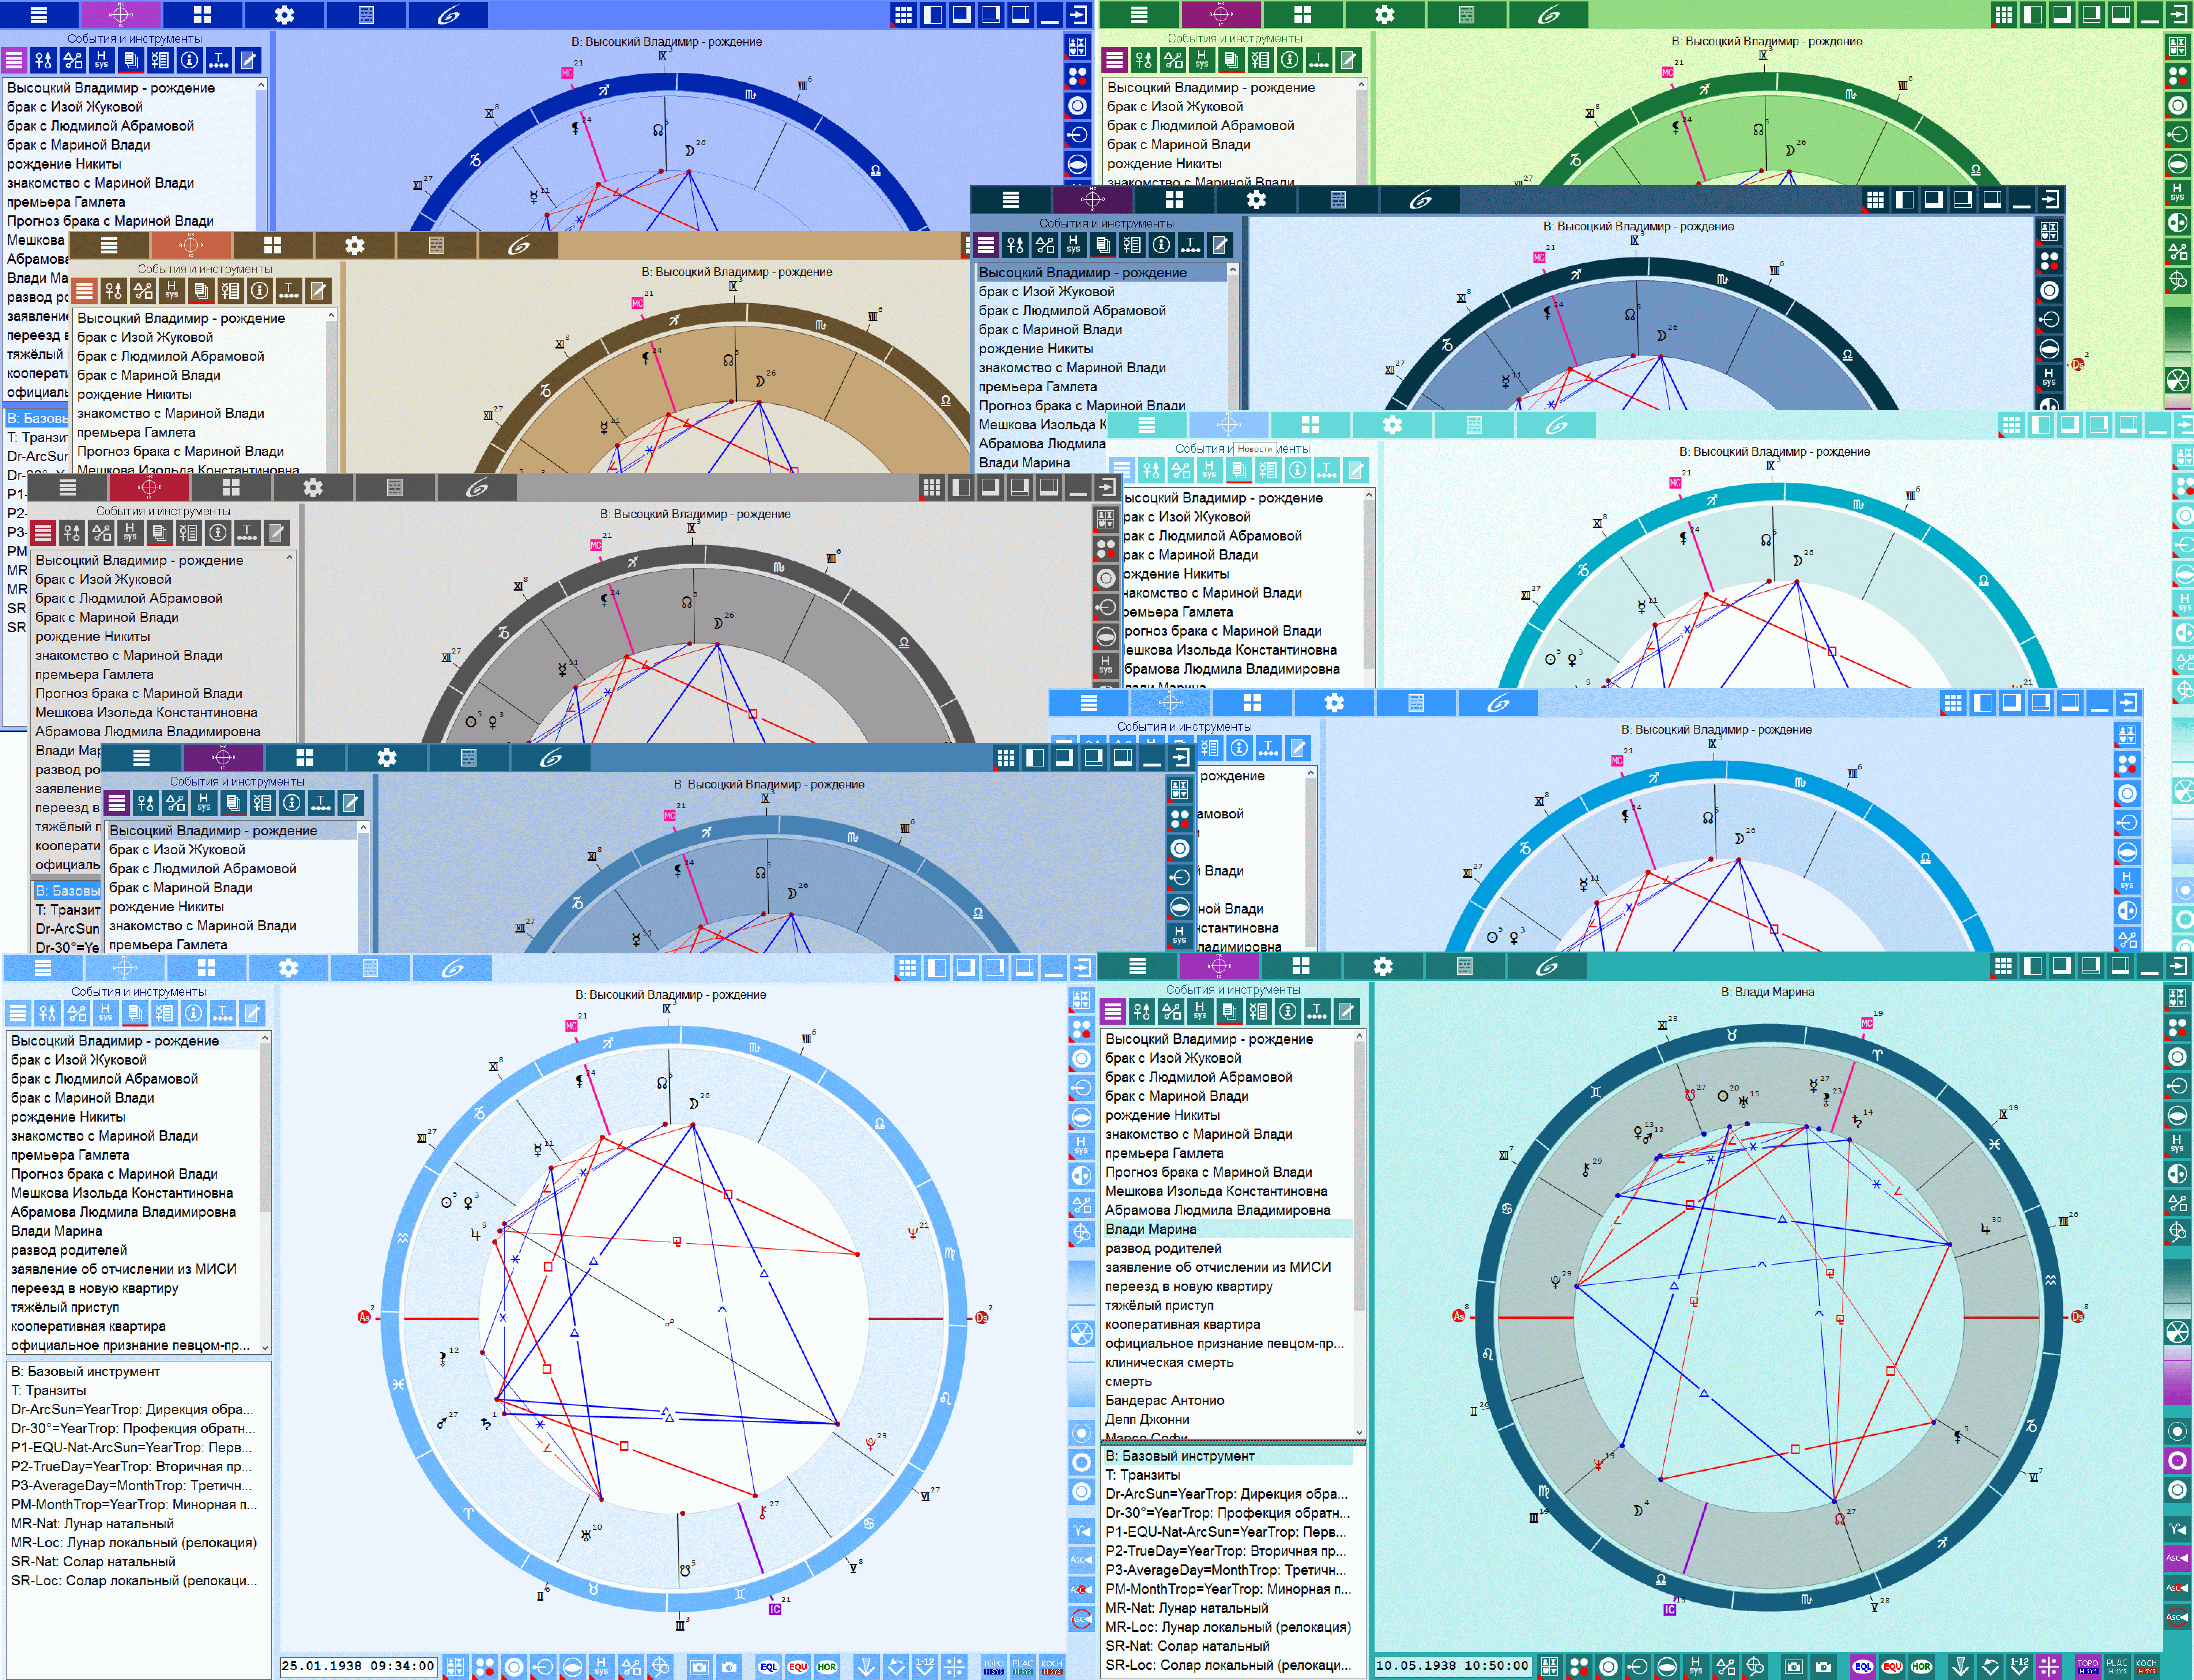
| (module Charts++) 'Event - Instruments' multi-mode. In this mode, you can display 9 astrological instruments (transits, directions, progressions, etc.) for one current event. Number of simultaneously displayed pairs of charts depends on the capabilities of a monitor or multiple monitors: the larger the monitor is, the more pairs of charts can be displayed for work |
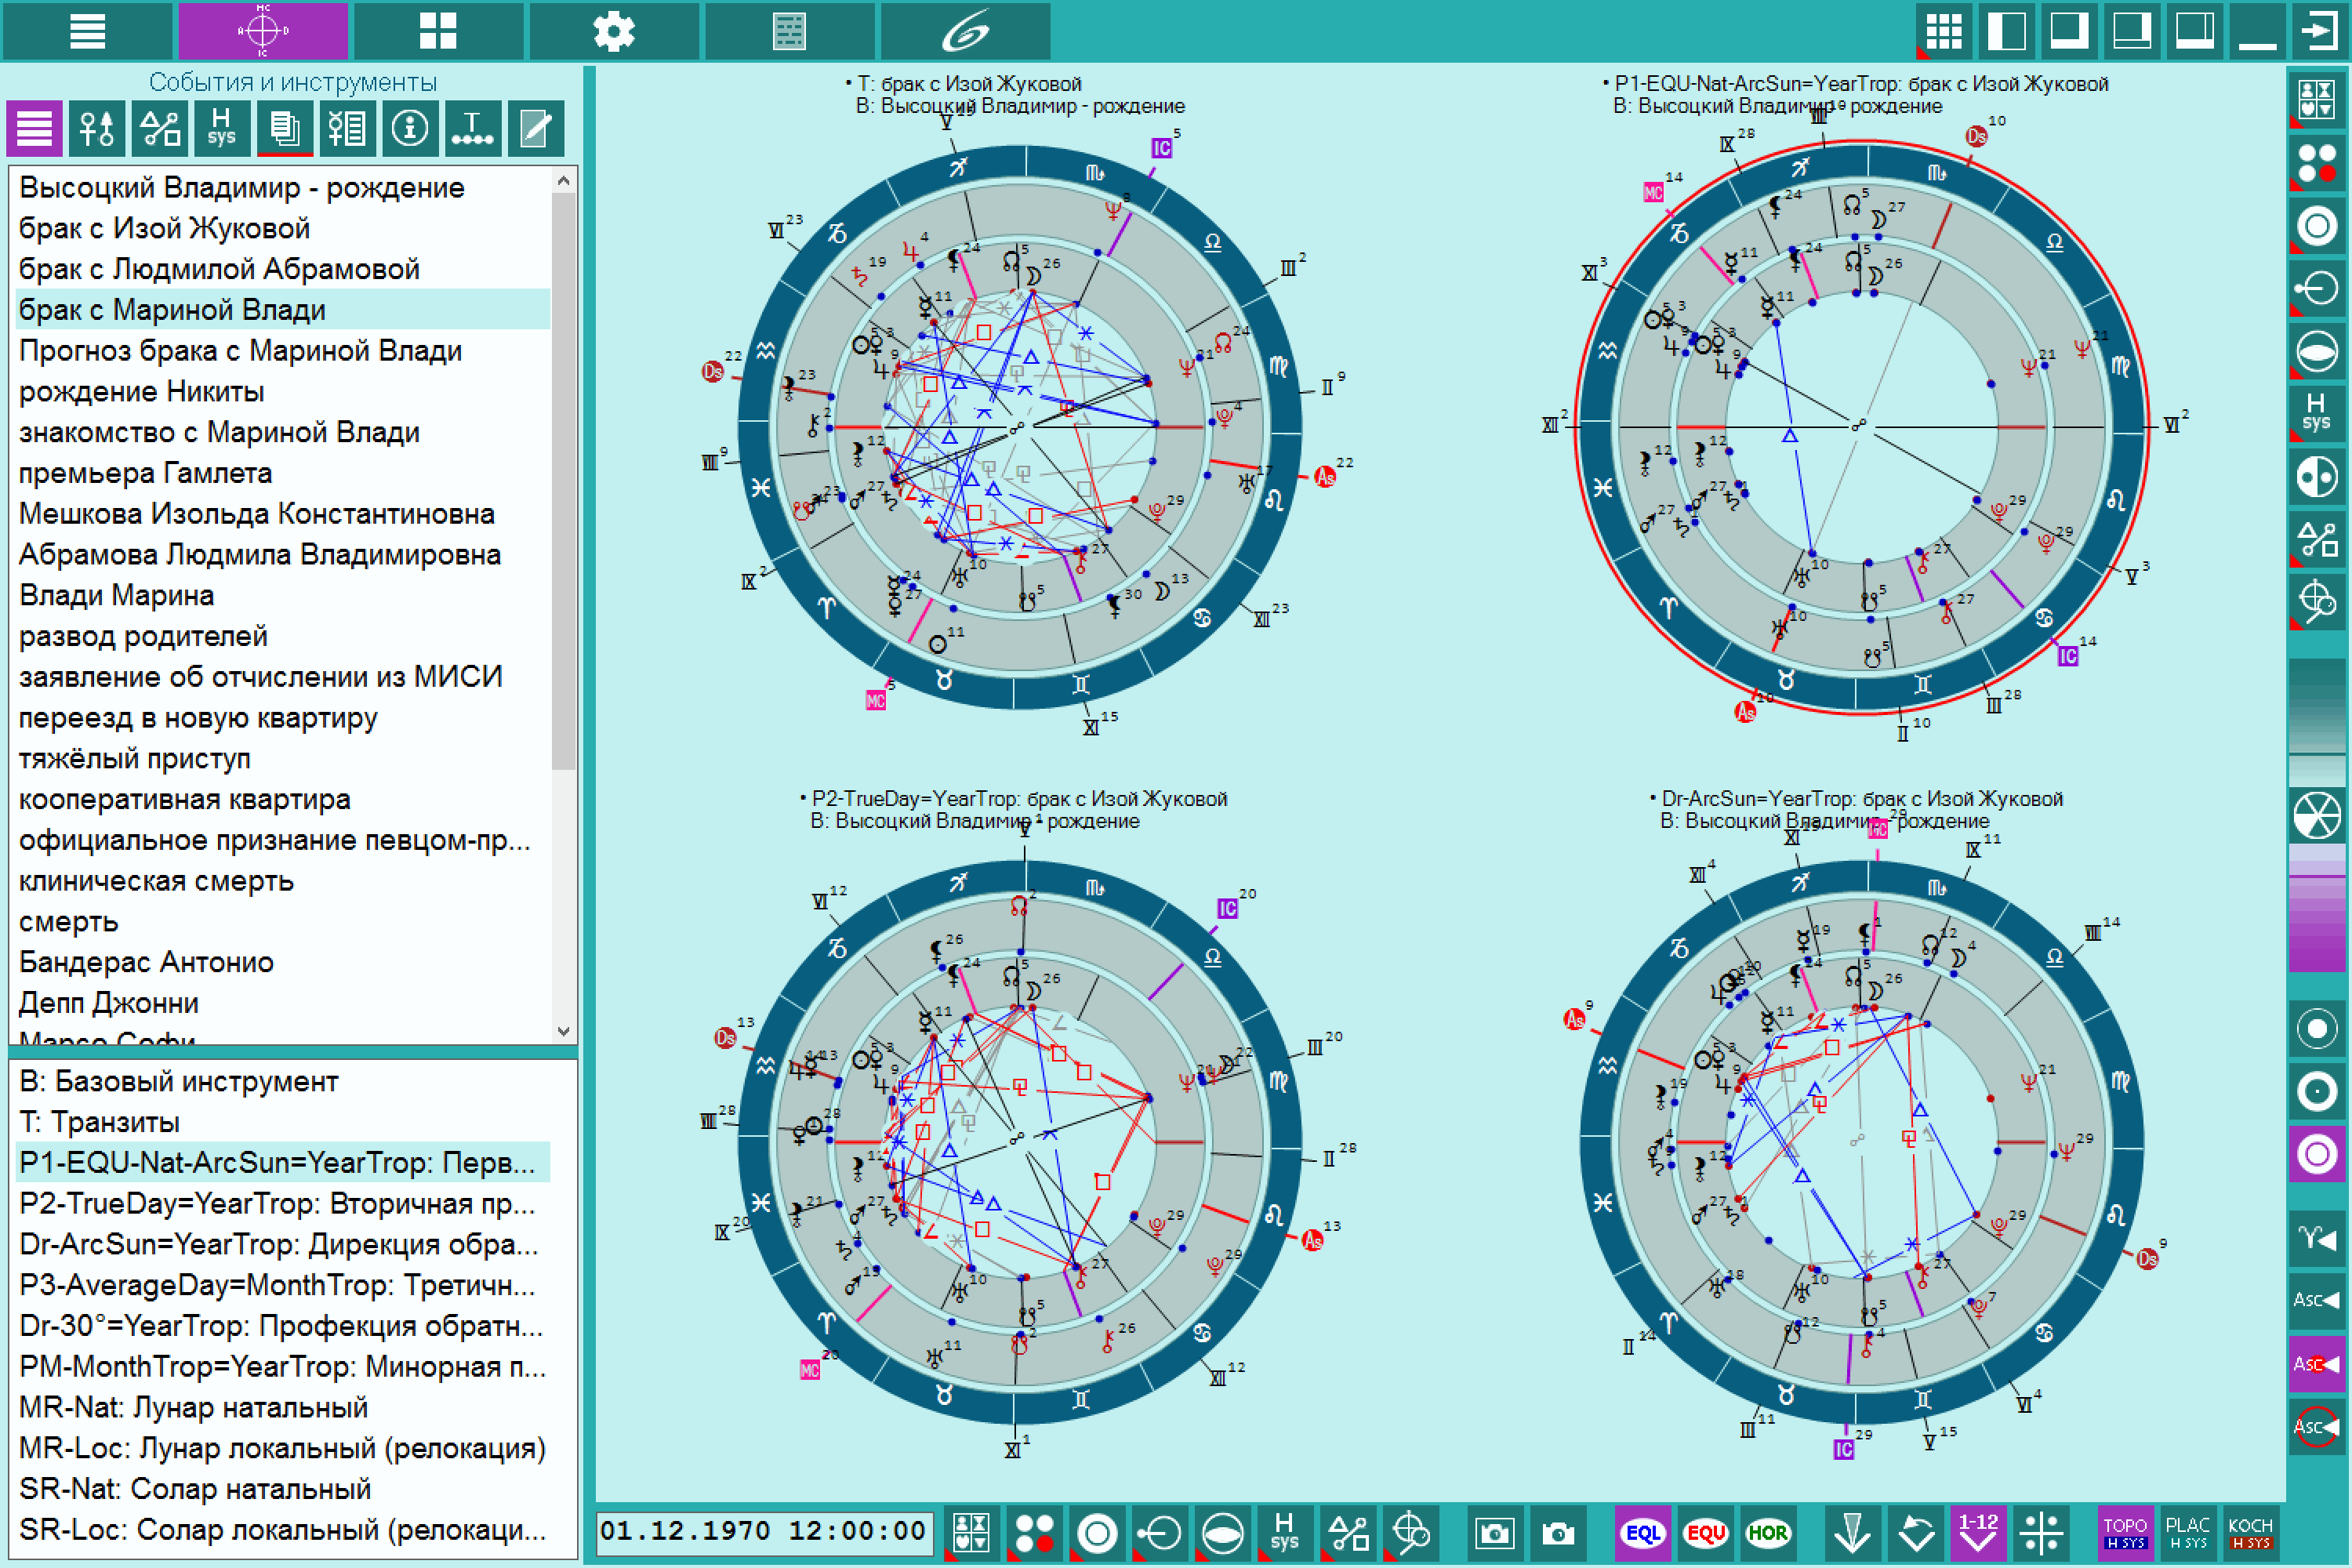
| (module Charts++) 'Instrument - Events' multi-mode. In this mode, you can display up to 9 events for one astrological instrument (transits, directions, progressions, etc.). Number of simultaneously displayed pairs of charts depends on the capabilities of the monitor or multiple monitors |

| (module Charts++) 'Instruments - Event' multi-mode with the disabled multifunction panel. You can temporarily disable the multifunction panel for more efficient use of screen space |

| (module Charts++) 'Freestyle' multi-mode on the double screen. This mode allows to simultaneously display up to 9 single and dual charts in different planes, different house systems and for any available astrological instrument |

| (module Charts++) Freestyle multi-mode on a double screen with 9 pairs of charts in its maximum configuration. It is necessary to have a large space to display charts to work with such configuration. For example, use multiple monitors or 4K SHD/8K UHD monitor |

| 'Lunar Calendar' plug-in. Galaxy uses modules that extend the functionality of the program |
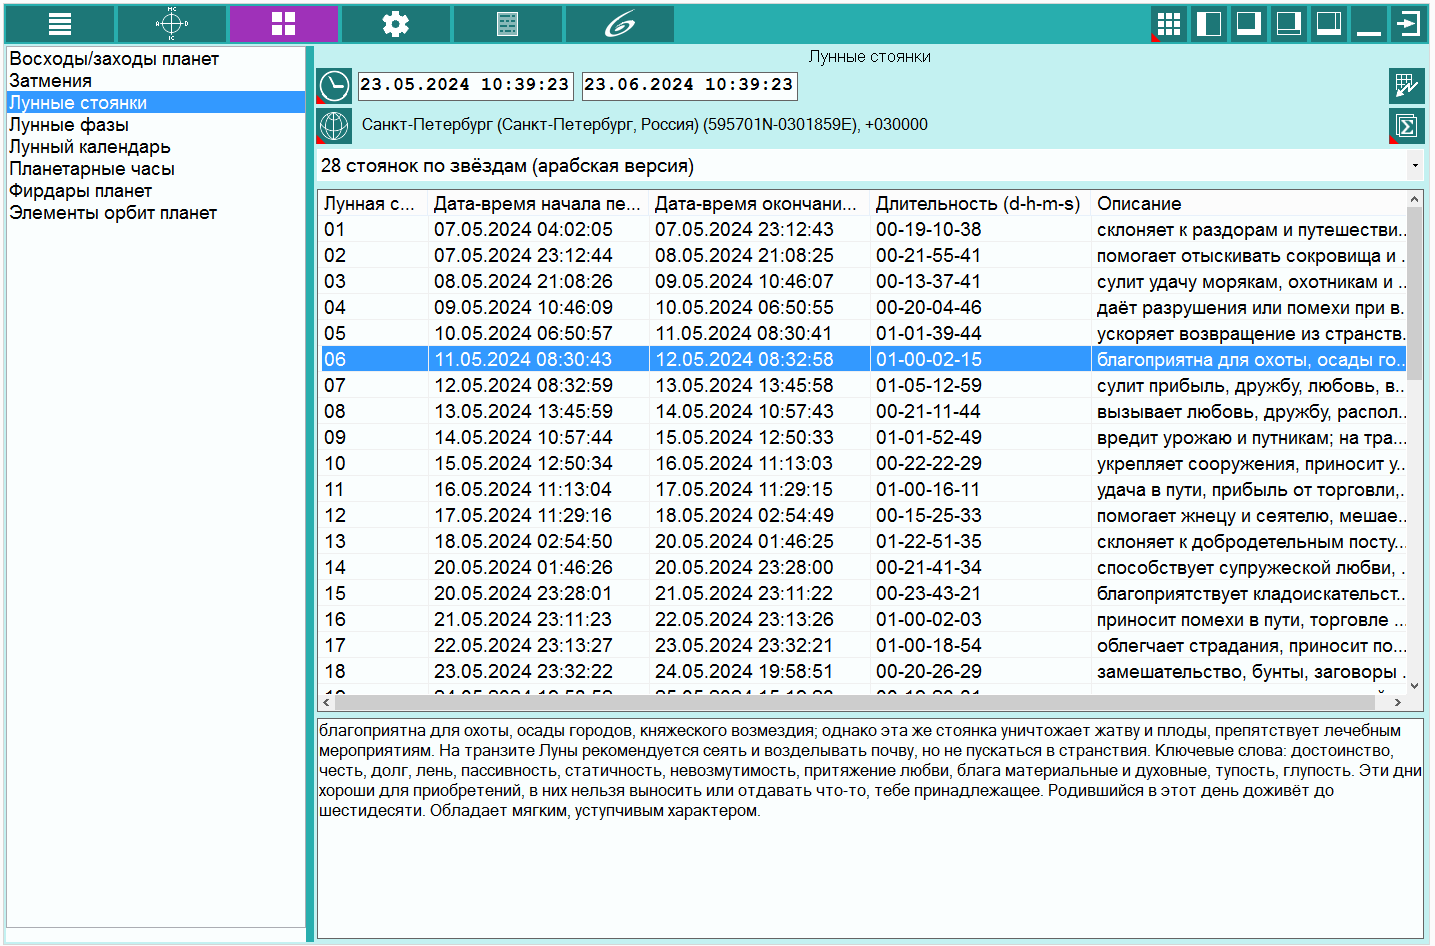
| Extension module - "Lunar houses". Galaxy uses modules that expand the functionality of the program |
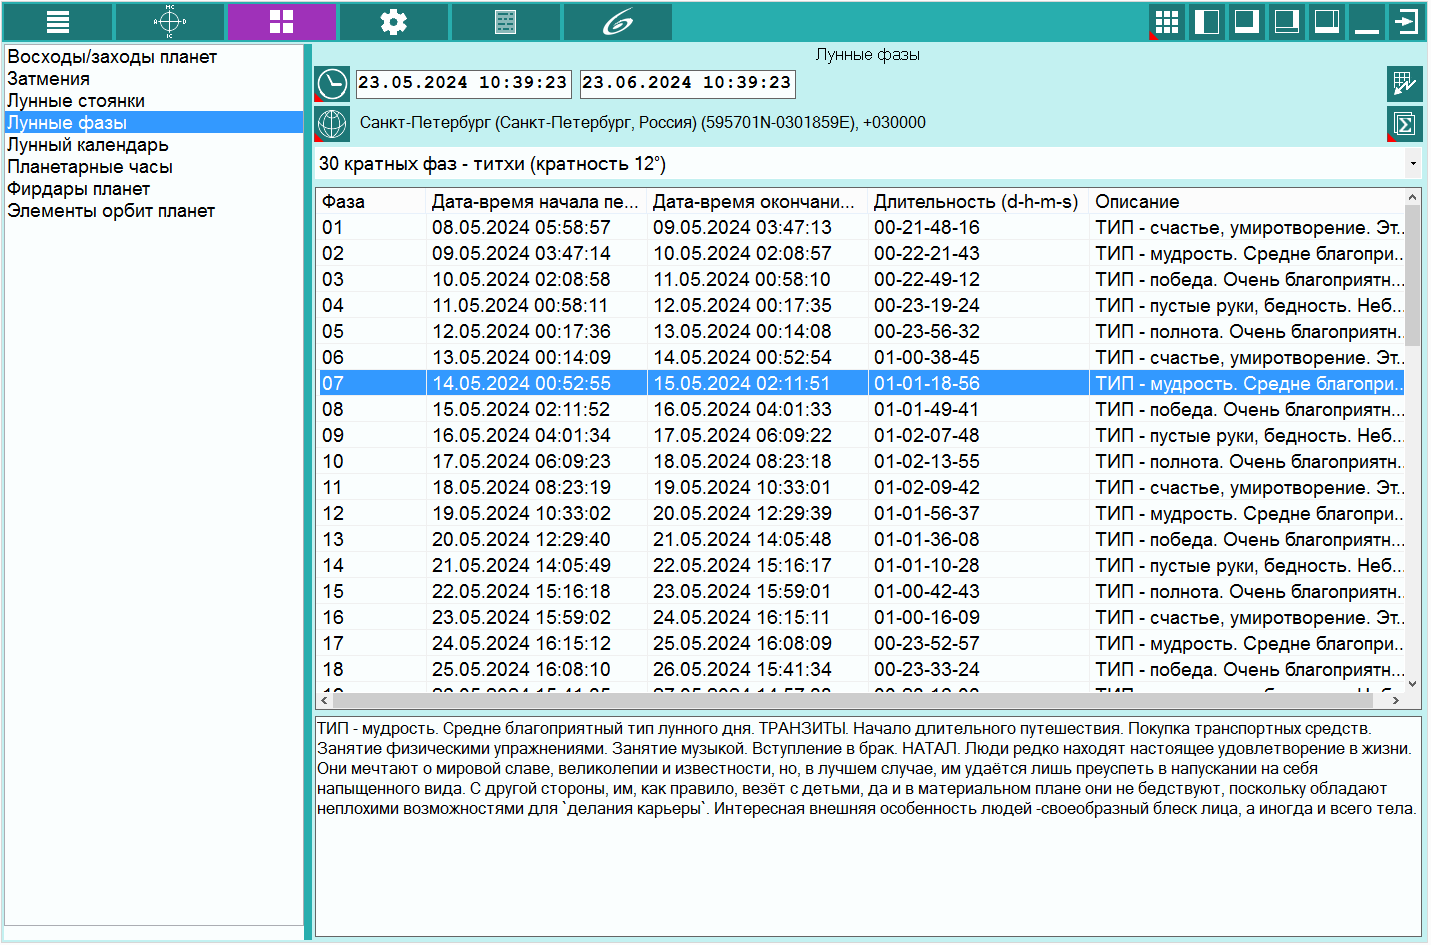
| Expansion module - "Moon phases". Galaxy uses modules that expand the functionality of the program |
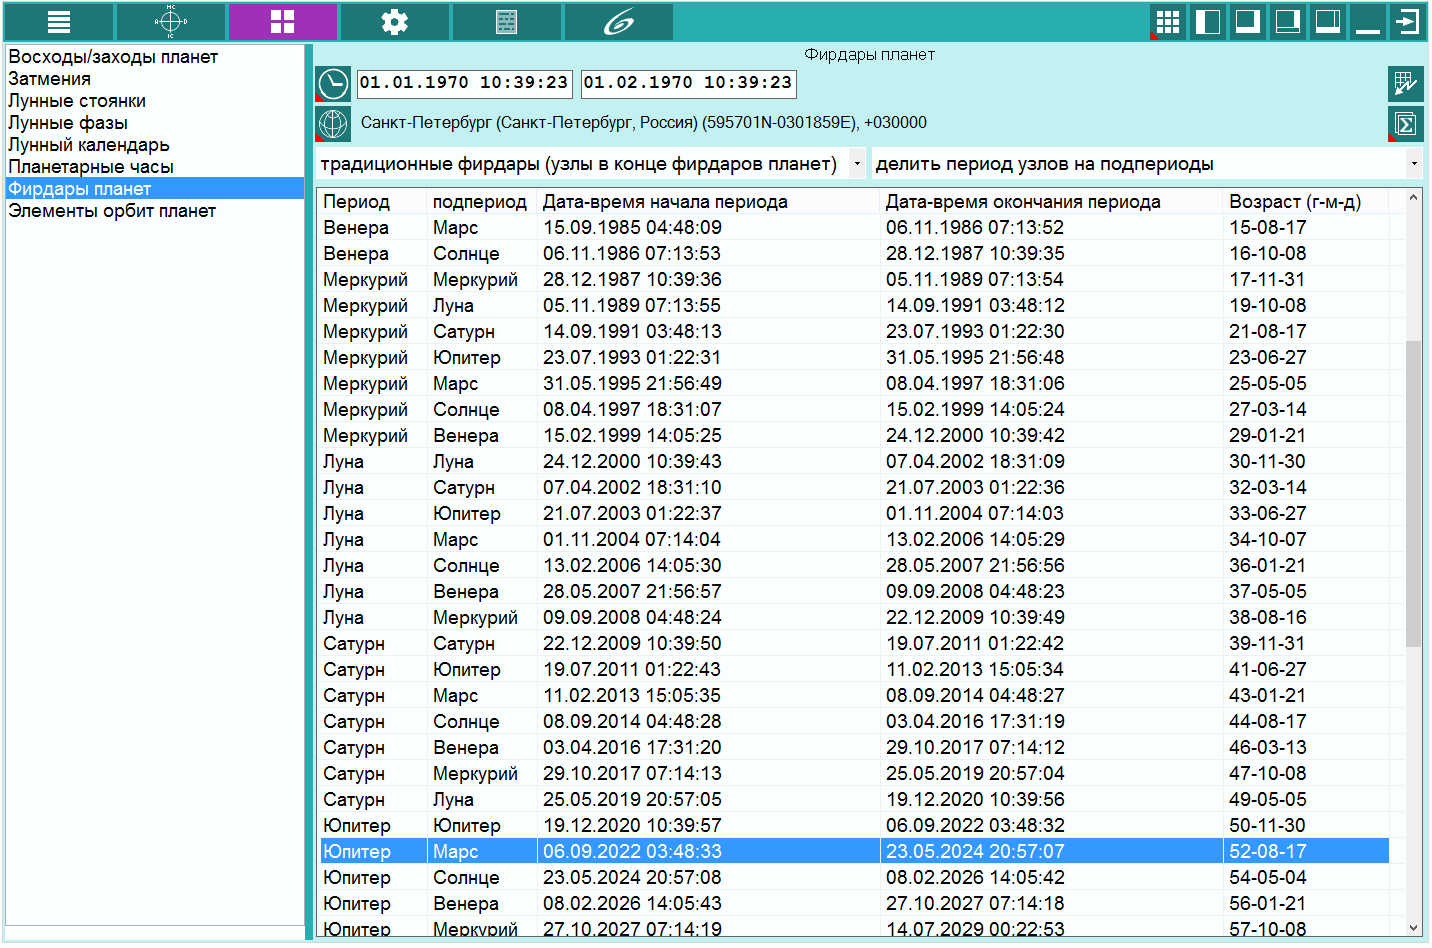
| Extension module - "Firdary". Galaxy uses modules that expand the functionality of the program |
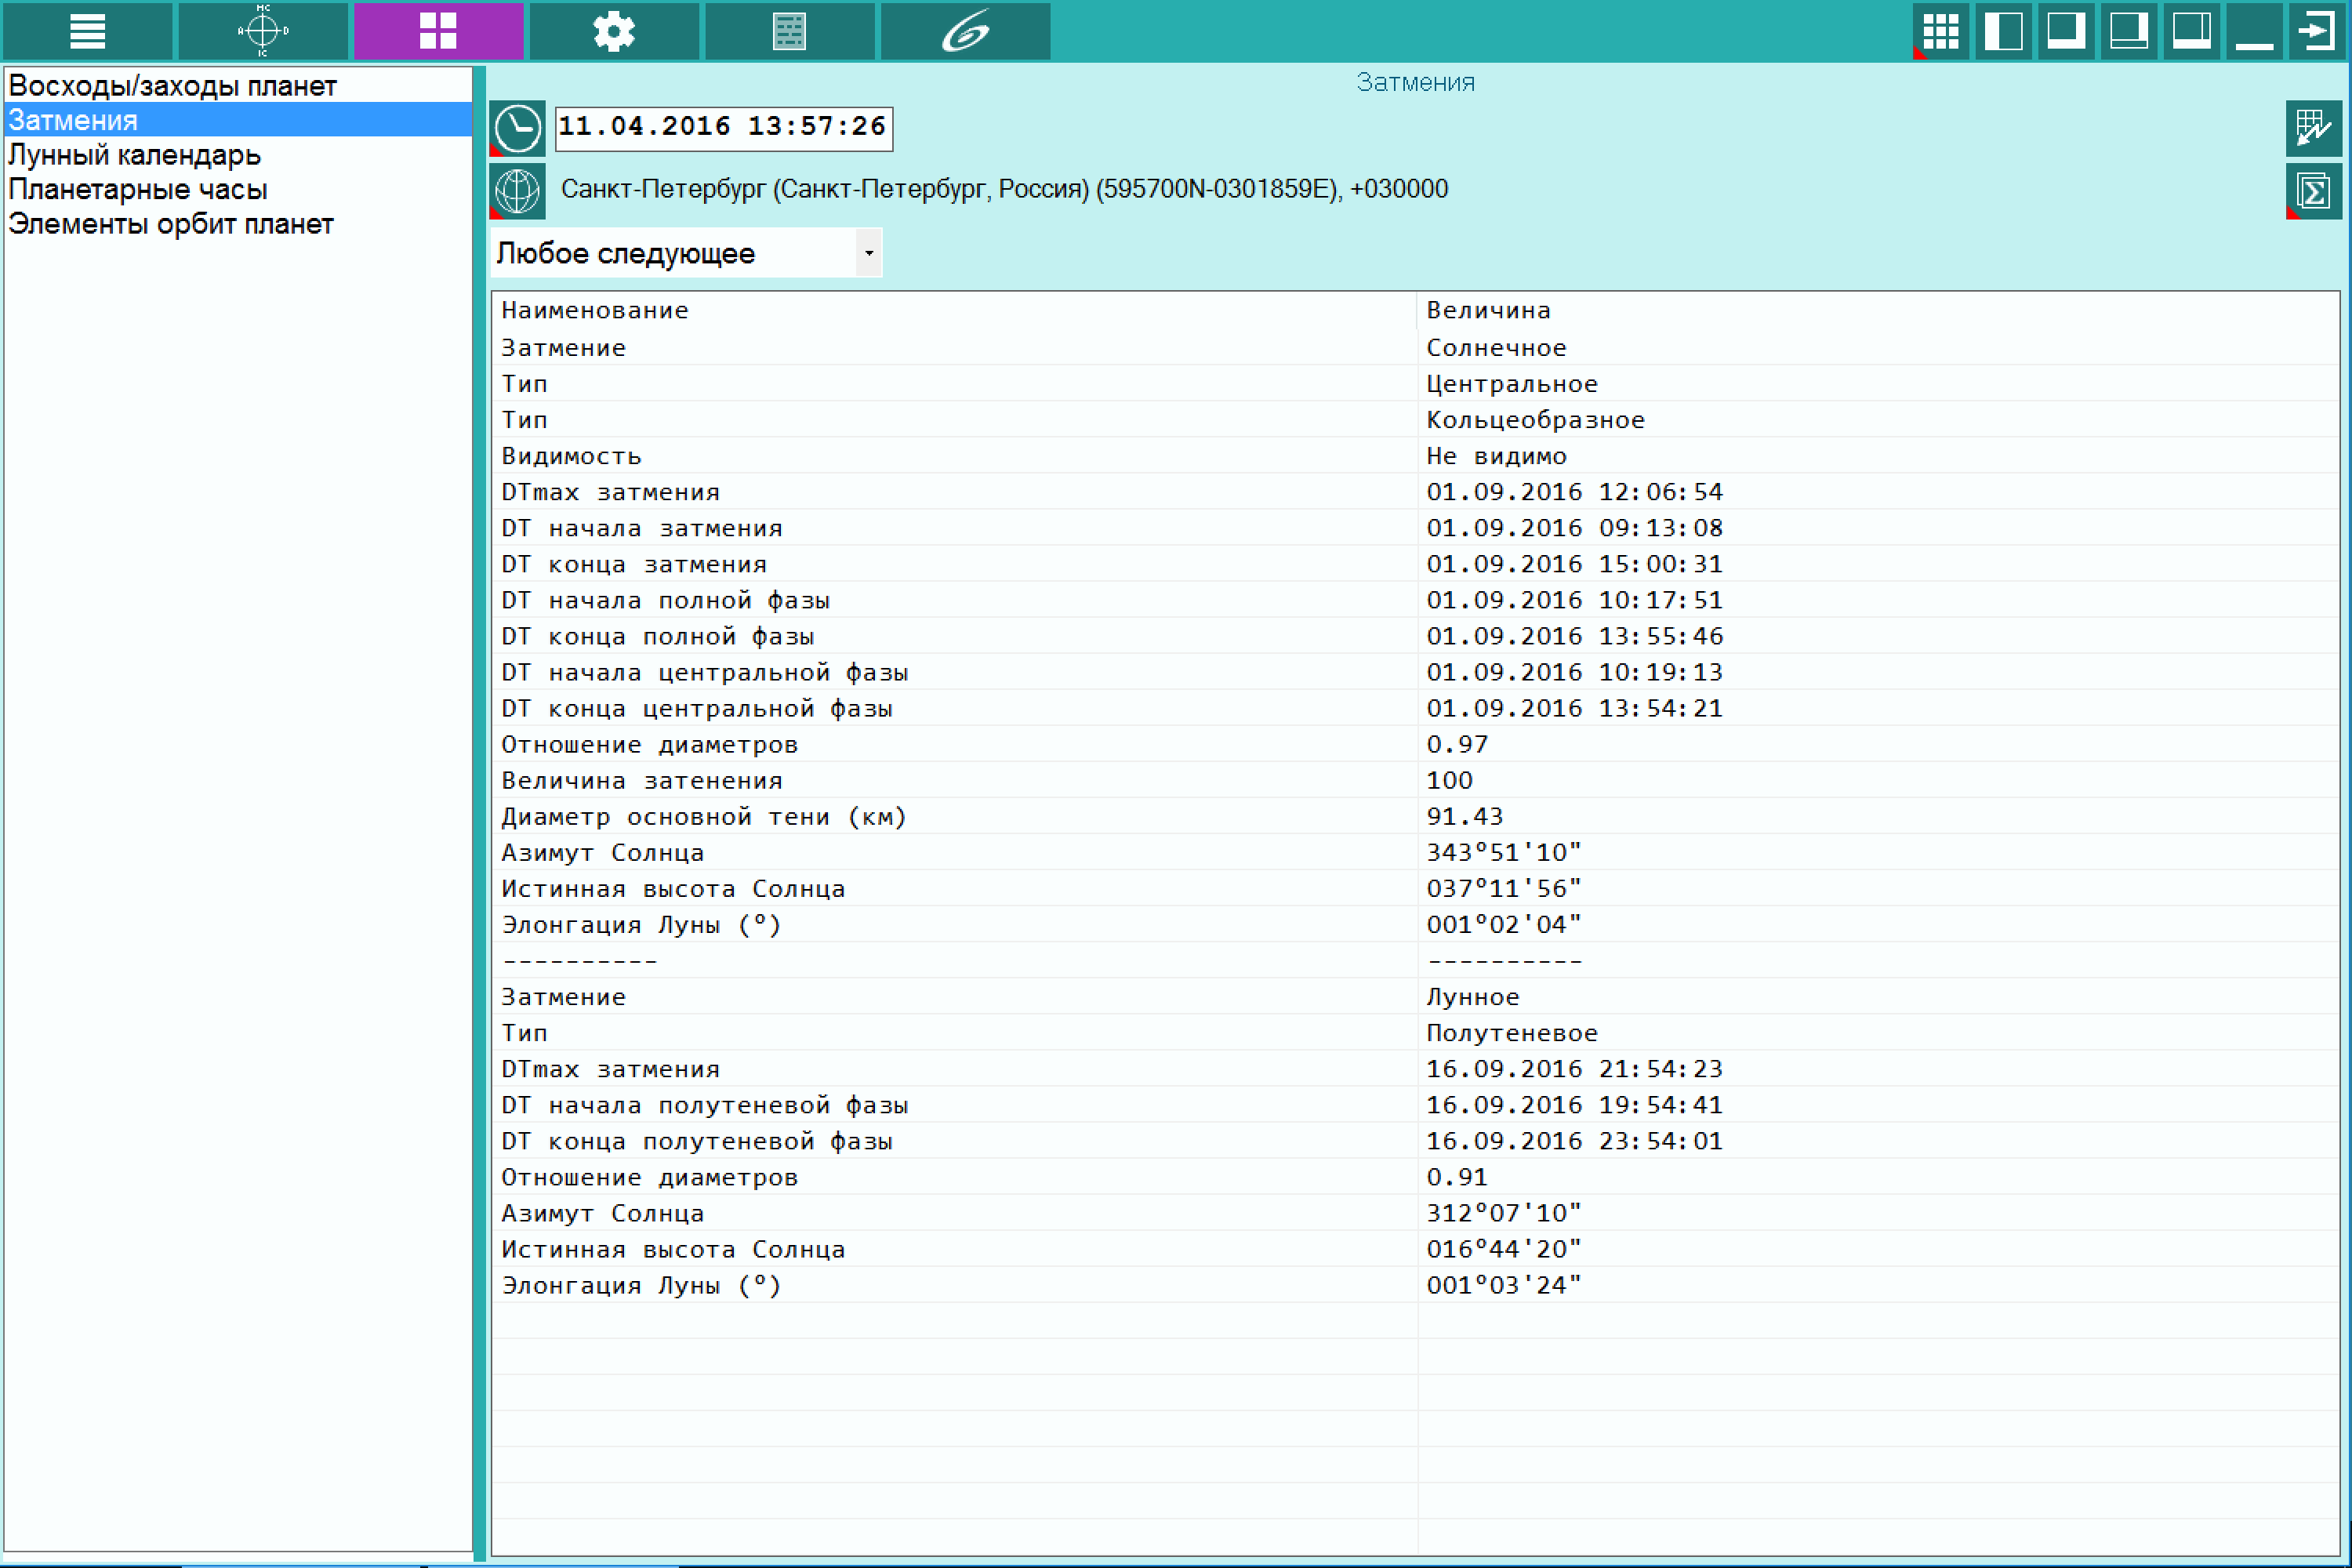
| 'Eclipse' plug-in. The module extends the program capabilities to calculate eclipses. You can save the moments of eclipses in terms of the time points and then easily create a chart for work |
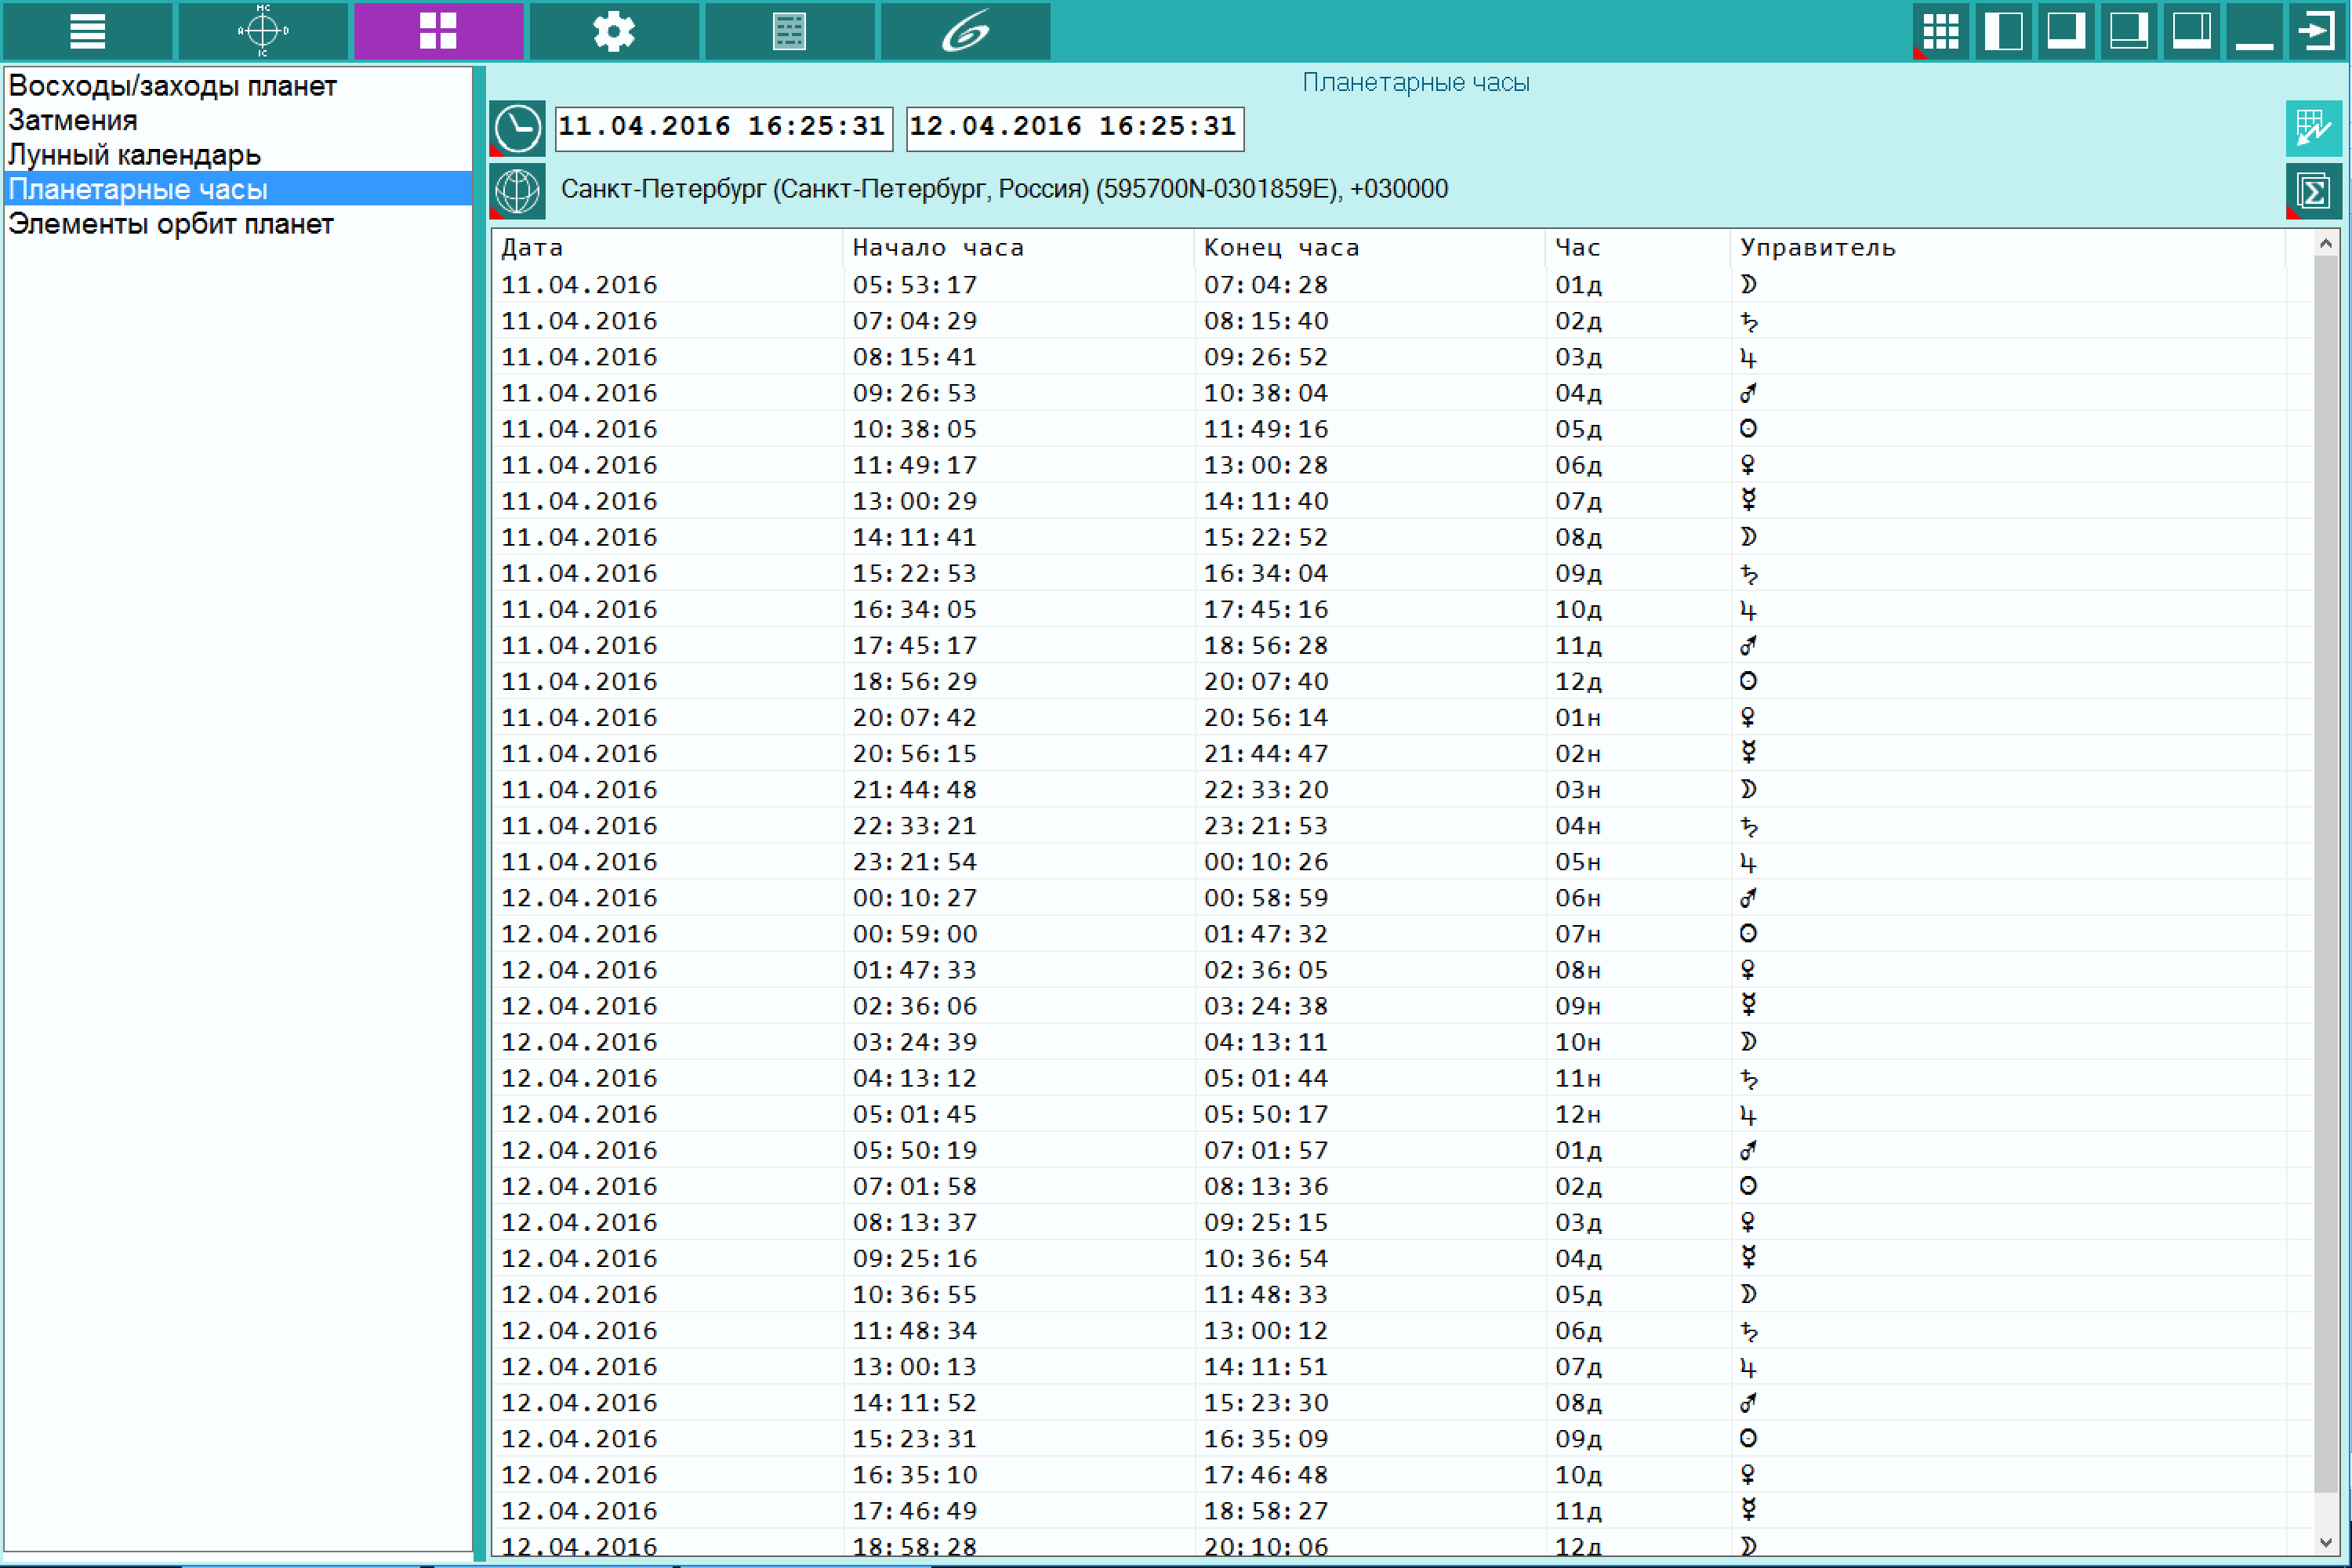
| 'Planetary hours' plug-in. The results can be saved in a spreadsheet file and printed, or you can take a screenshot or specified area |

| 'Elements of planet orbits' plug-in. For astrologers who use not only the moon's nodes but other nodes in their work the module can provide information on the elements of the orbits of the other planets and asteroids |
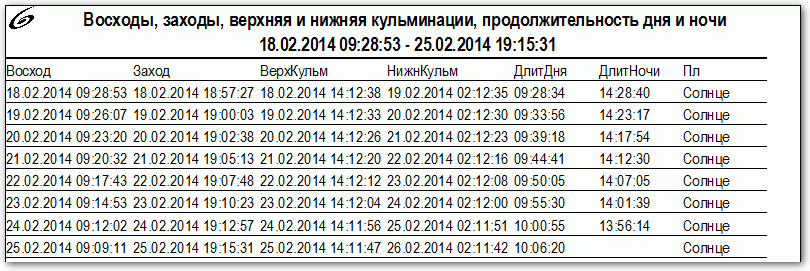
| Print of 'Planet rises/sets' module |

| Print of 'Eclipse' module |
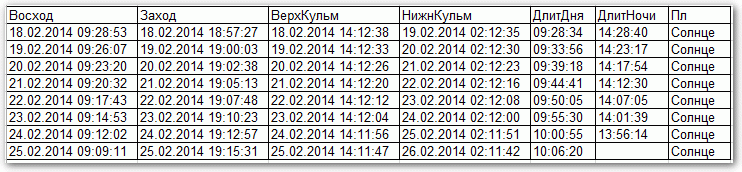
| The result is stored in a spreadsheet file of 'Planet rises/sets' module |

| Universal screen of display of settings and control issues |
| Collage of design color schemes of Galaxy software. An astrologer can select one of 10 basic balanced color schemes for chart design and display |
| Collage of button shapes. A user can select one of four shapes of buttons (from square to round) |
| Collage of astrological programs included in Galaxy software package |
Screenshots of the ChartDecor module
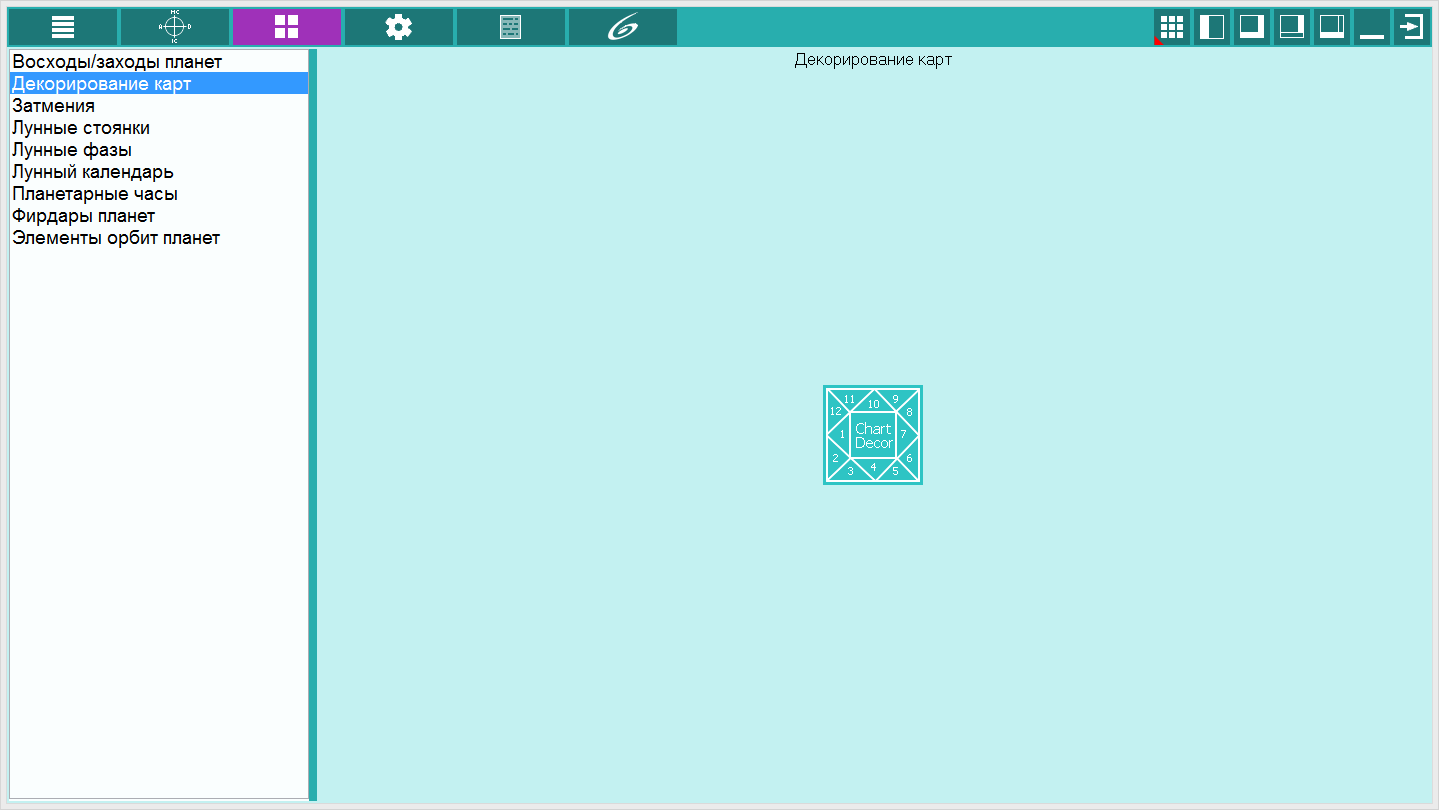 |
Plugin modules page. To open the ChartDecor module, you must select the "Chart decoration" module from the list of modules and click the "Open module" button. |
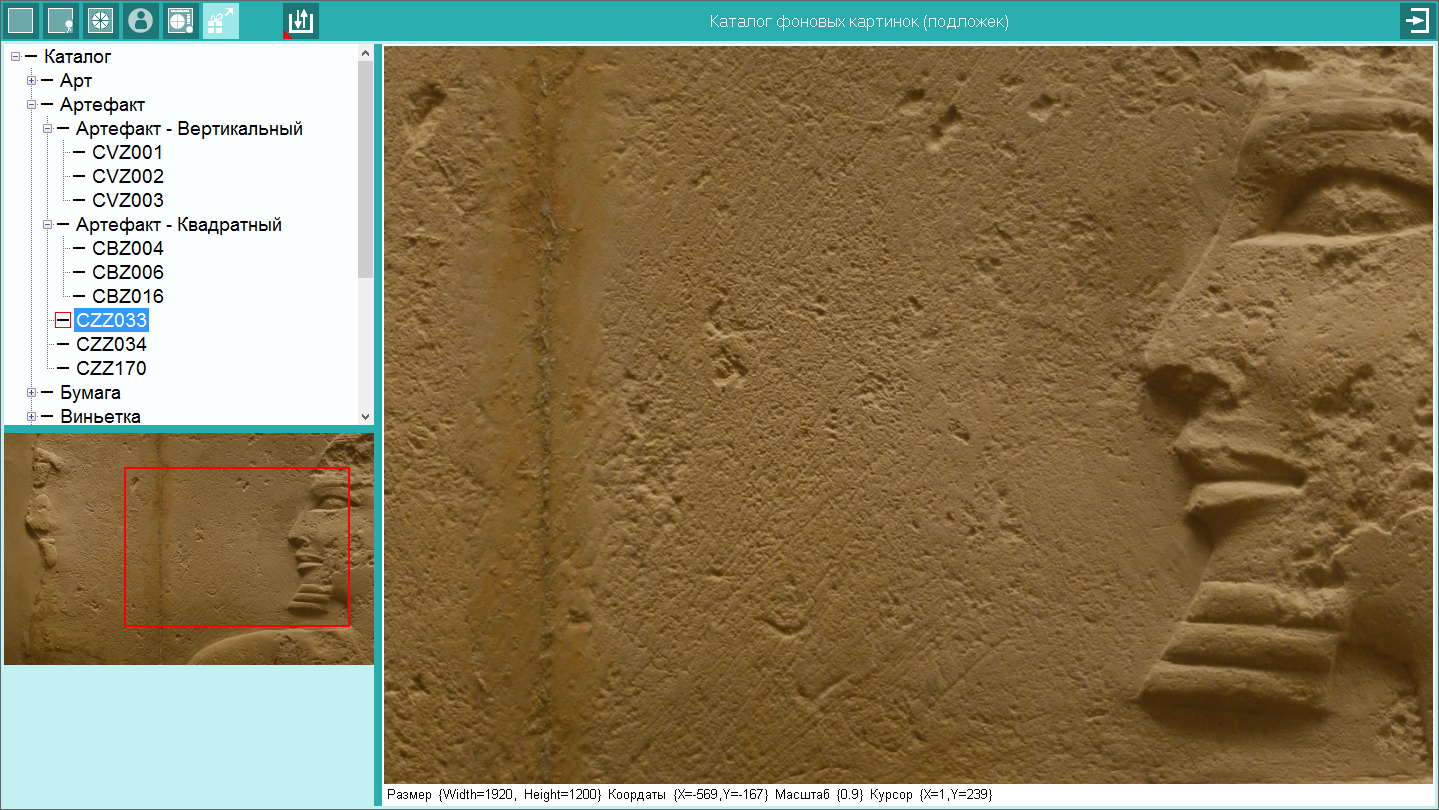 |
Catalog of background images. From this screen, a background image is selected, on the basis of which the project will be built.
|
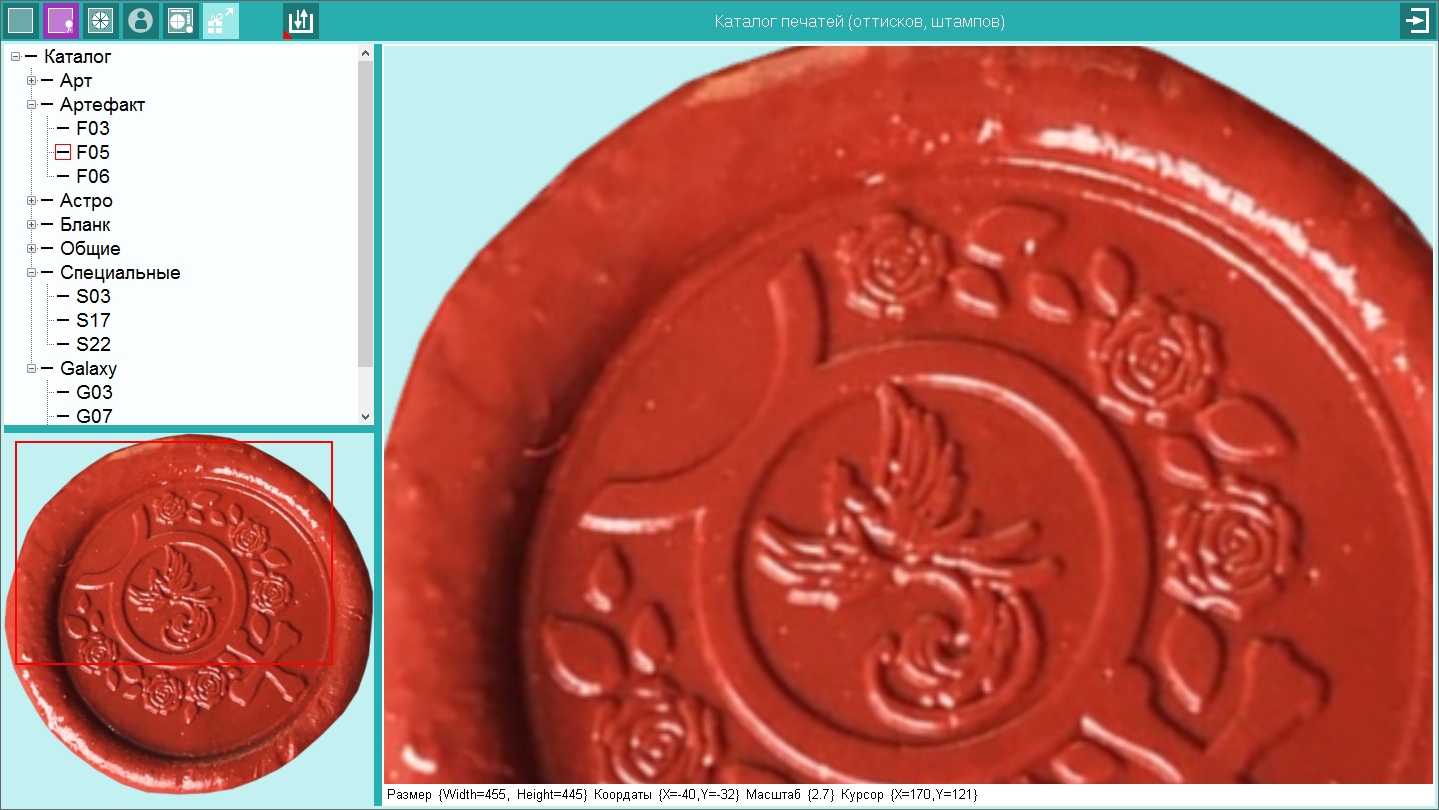 |
Catalog of seals (stamps). From this screen, you select a print image (stamp) to display in the project. Seal images have a transparent background for seamless overlay on the background image. The catalog of stamps contains many different groups: from pictures-artifacts to modern and specialized types. The actions on this screen fully correspond to the work with the background pictures screen. |
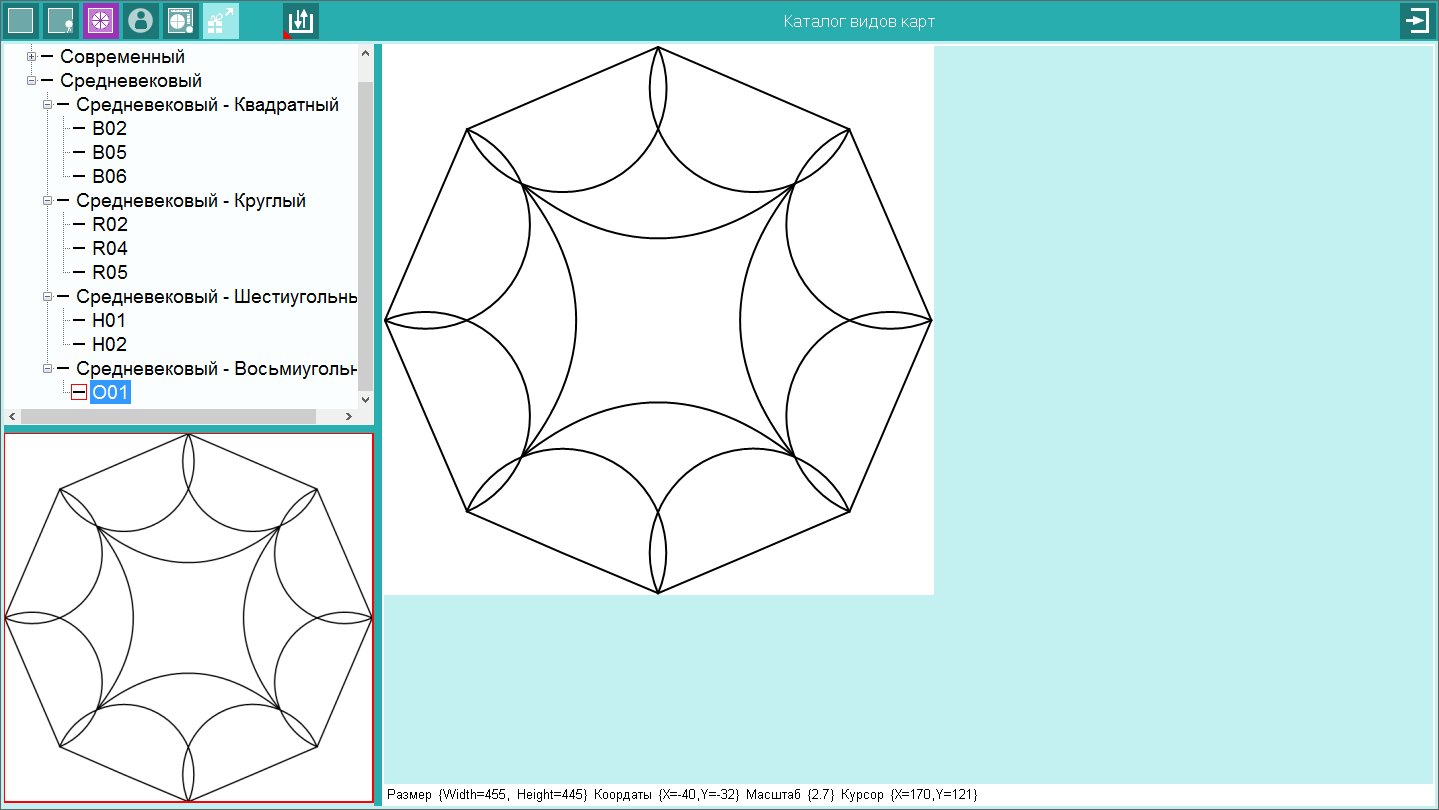 |
Catalog of chart types. From this screen, you select the type of chart for constructing an astrological chart in the project. Each chart is a vector-specific Galaxy format for easy scaling of line graphics and text. The catalog of chart types is divided into 2 parts:
|
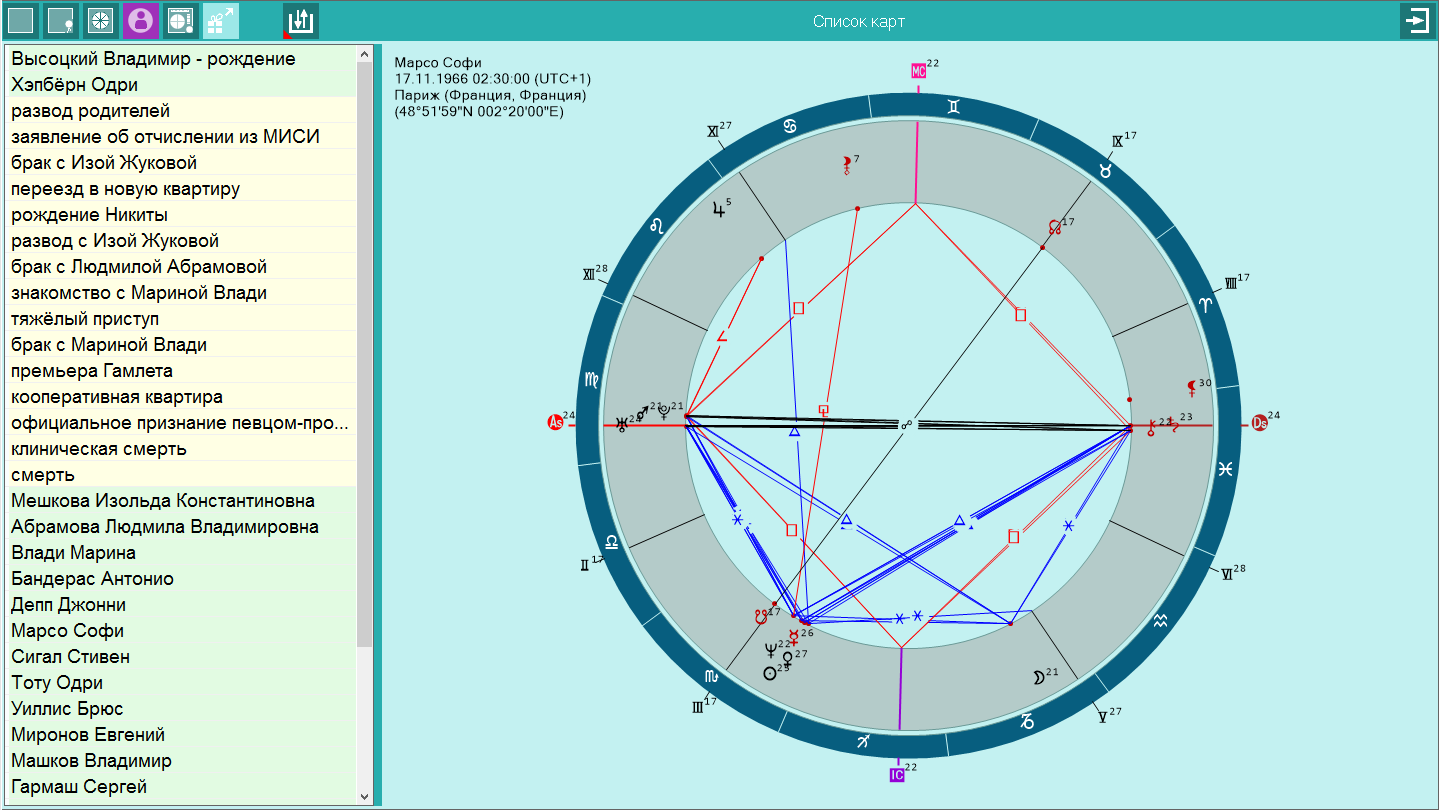 |
List of charts. List of astrological charts created and contained in the parent Charts program. For the decorator to work, you need to select one of the charts from the list for which you want to create a masterpiece :) The decorator allows you to work with natal, horary and event charts. In this case, a basic astrological tool (analogous to transits) is used. |
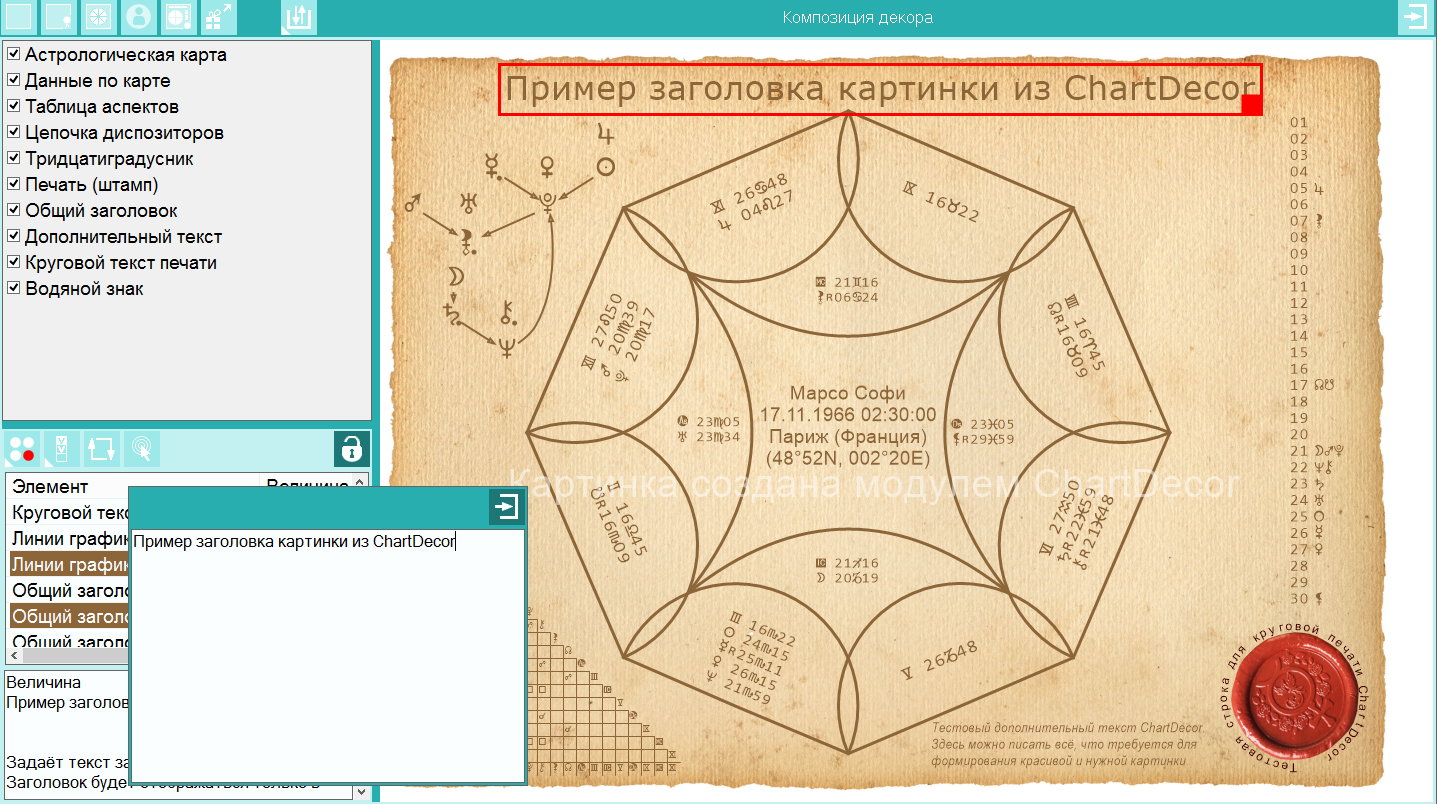 |
Decor composition. On this screen, the main type of work on decorating the selected astrological chart is performed. There are 2 lists on the screen:
|
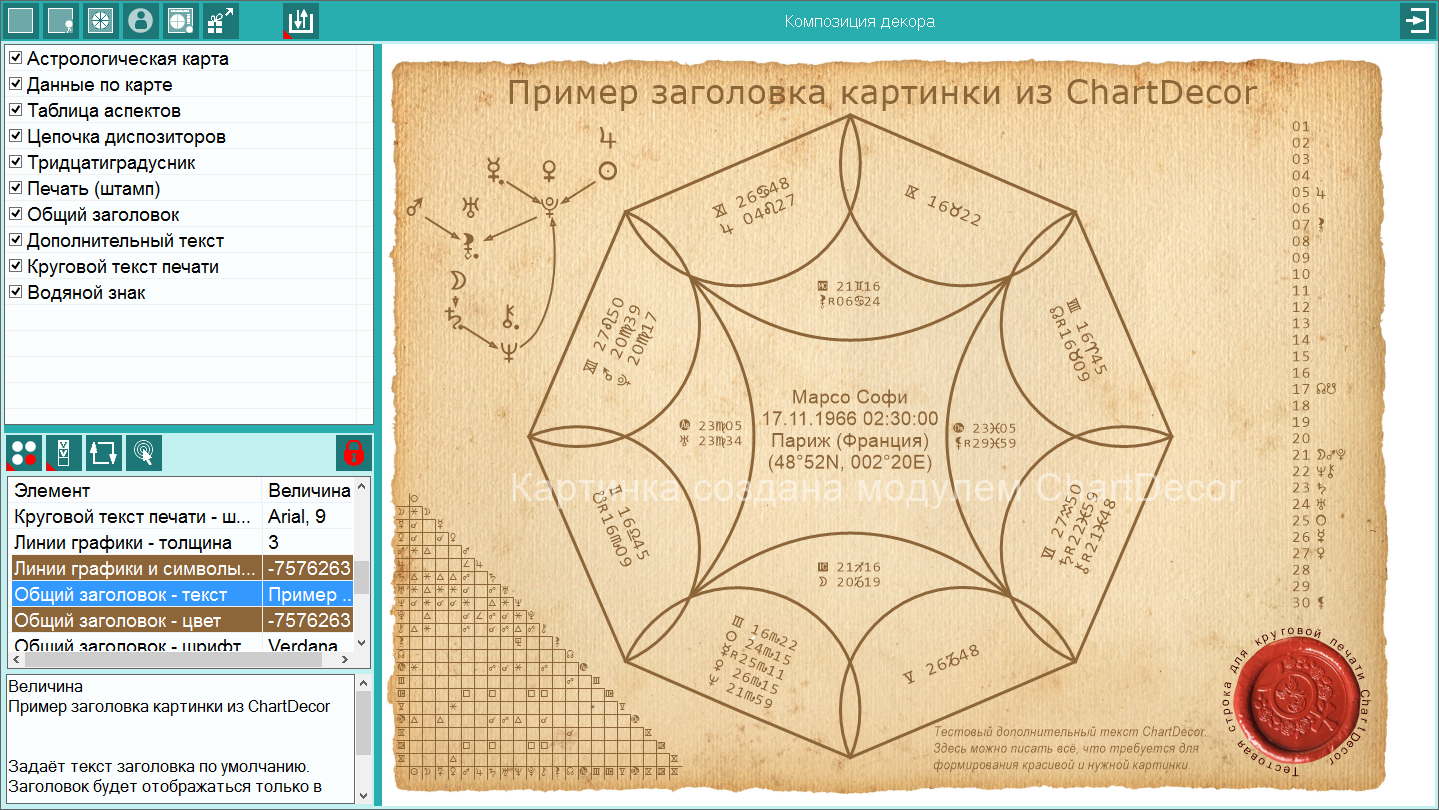 |
The result is the decor composition in the ChartDecor module. Before creating the output file, the final view is displayed on the composition screen to the extent of the available screen space. If necessary, you can adjust the position of the blocks, include or exclude them from the final file. If the result of the composition satisfies aesthetic requirements, you can create an output file.. If necessary, the created layout can be saved for subsequent work with other astrological charts. Important! When saving a template, all elements of settings and blocks are saved, with the exception of data for constructing an astrological chart (name, date-time and place). This is done to unify the saved template. After loading the saved template, all that remains is to select the astrological chart and the decoration is ready! |
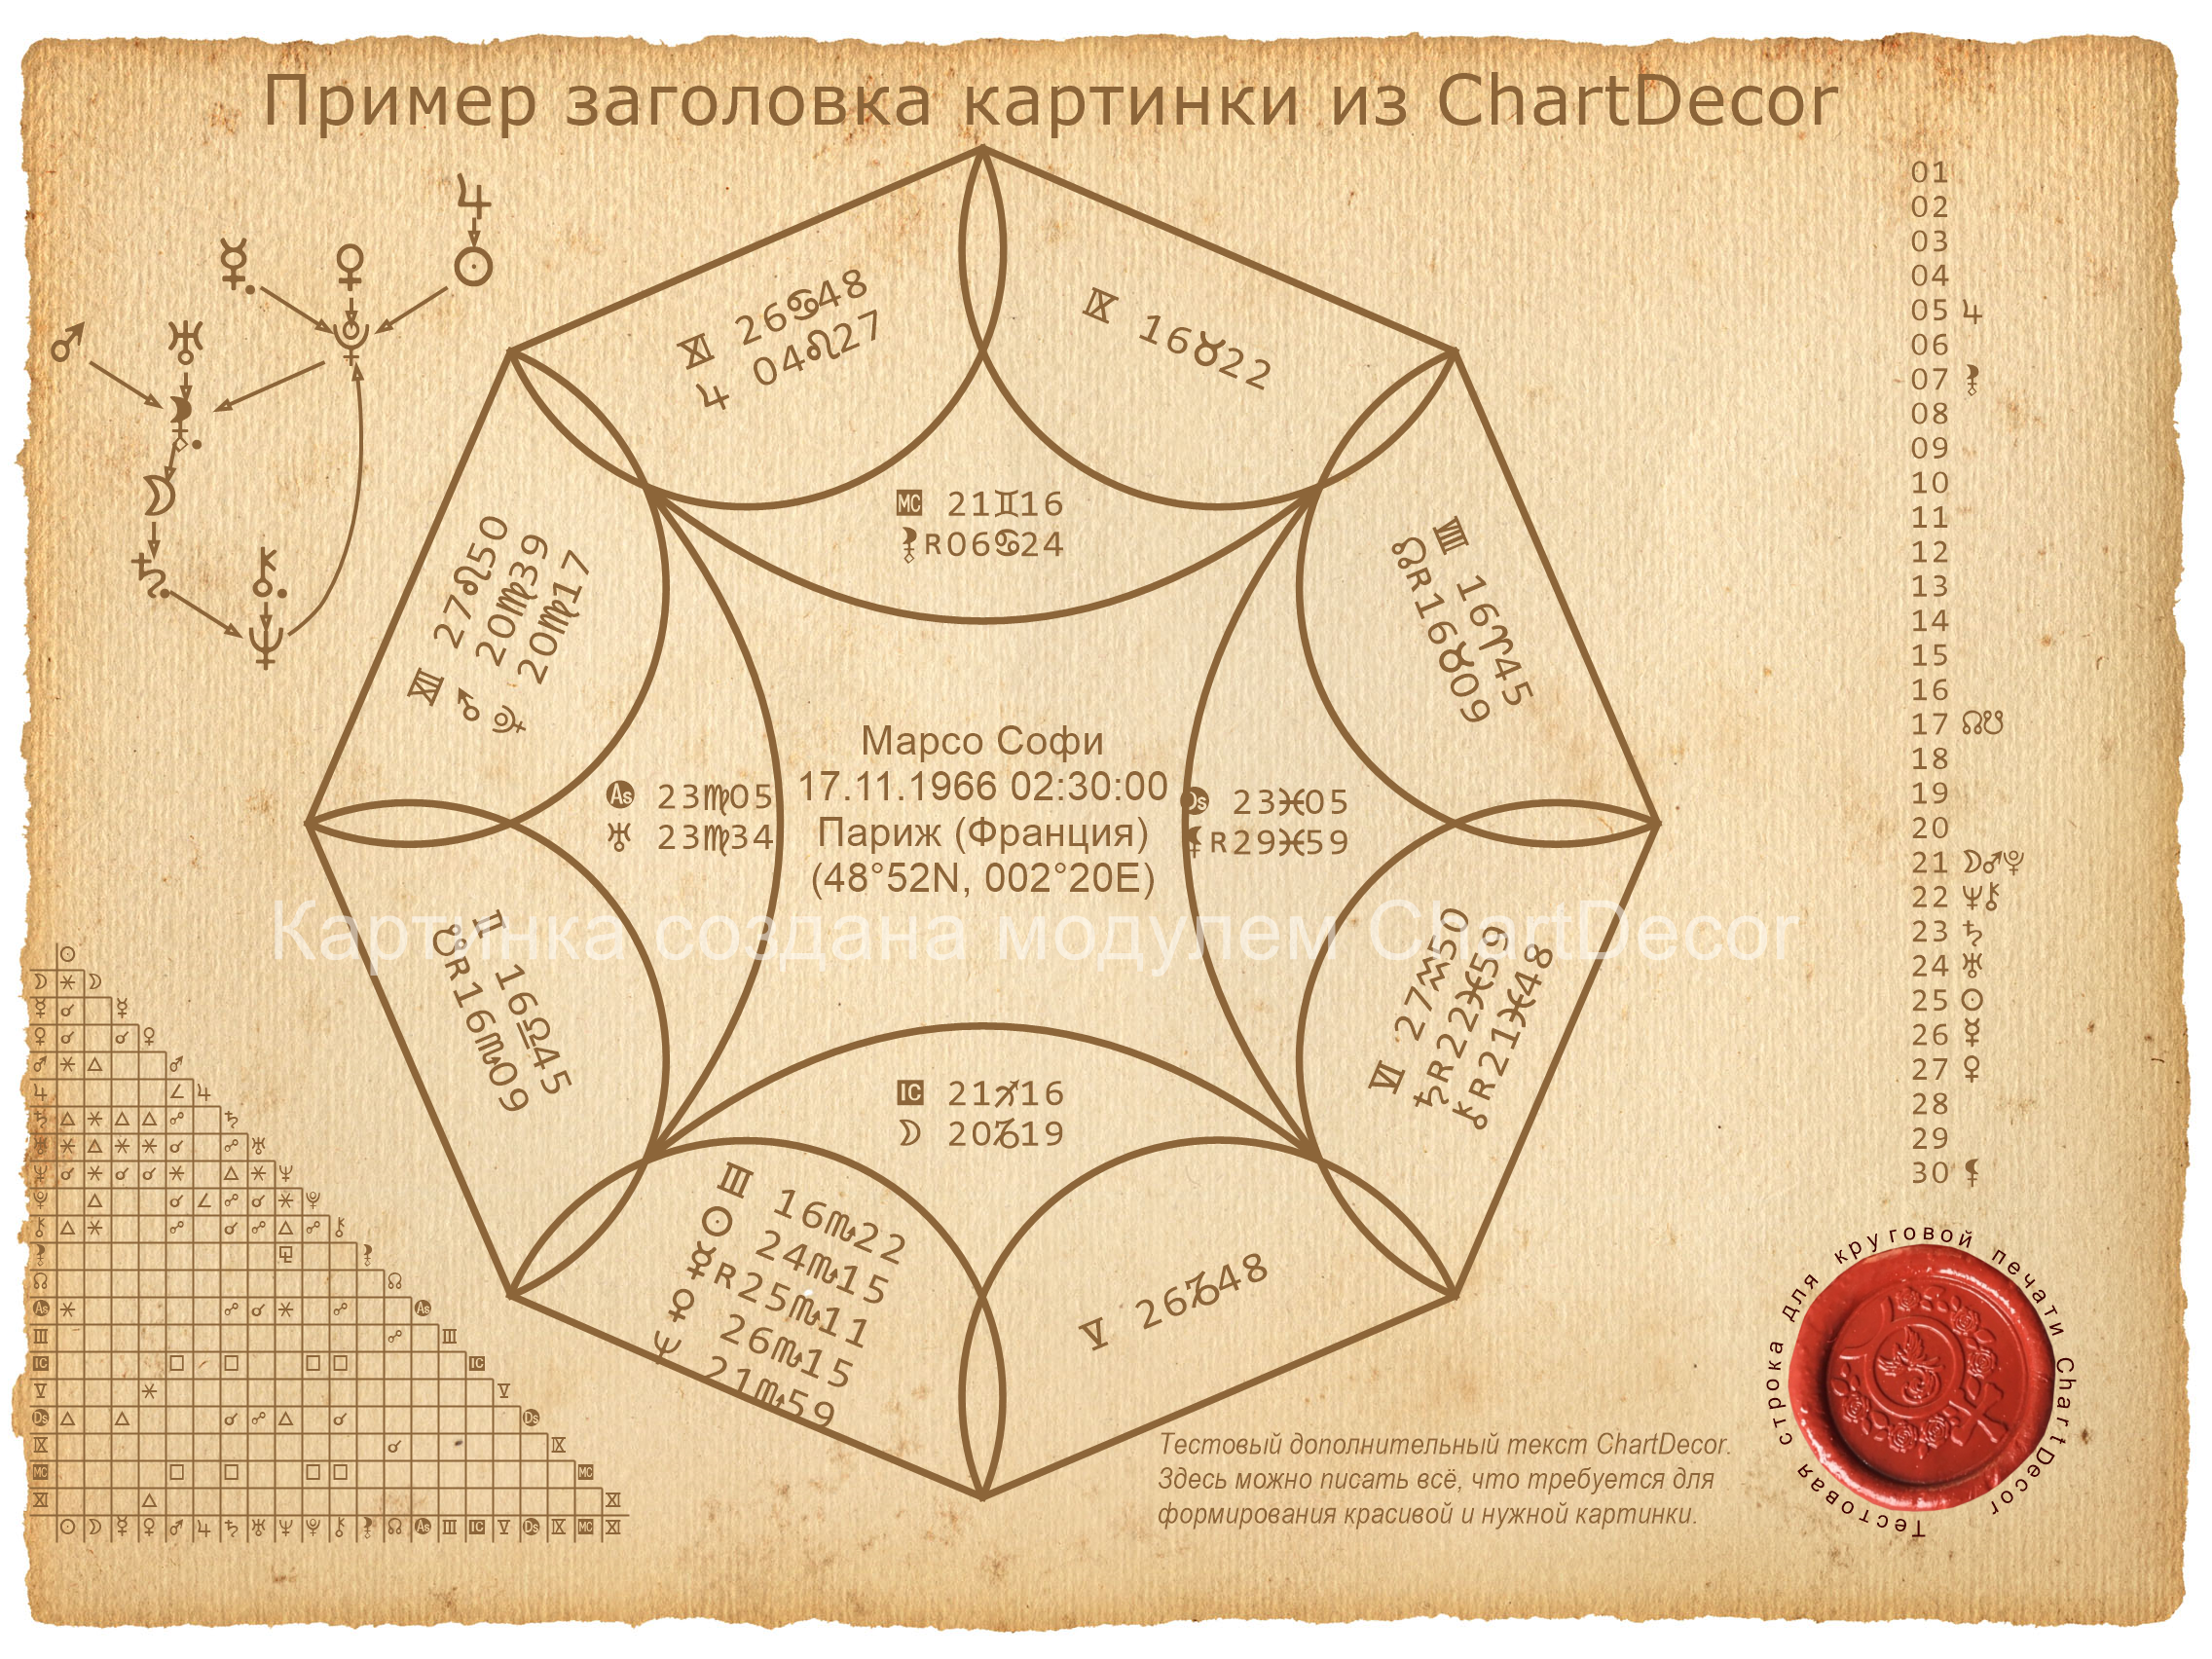 |
The resulting file is the result of the decorator`s work. After composition, you can create a final TIFF file for later printing. If you are not happy with something in the final file, for example, the font size of the symbols, you can open the table of elements for editing and set a smaller font size of the symbols. |
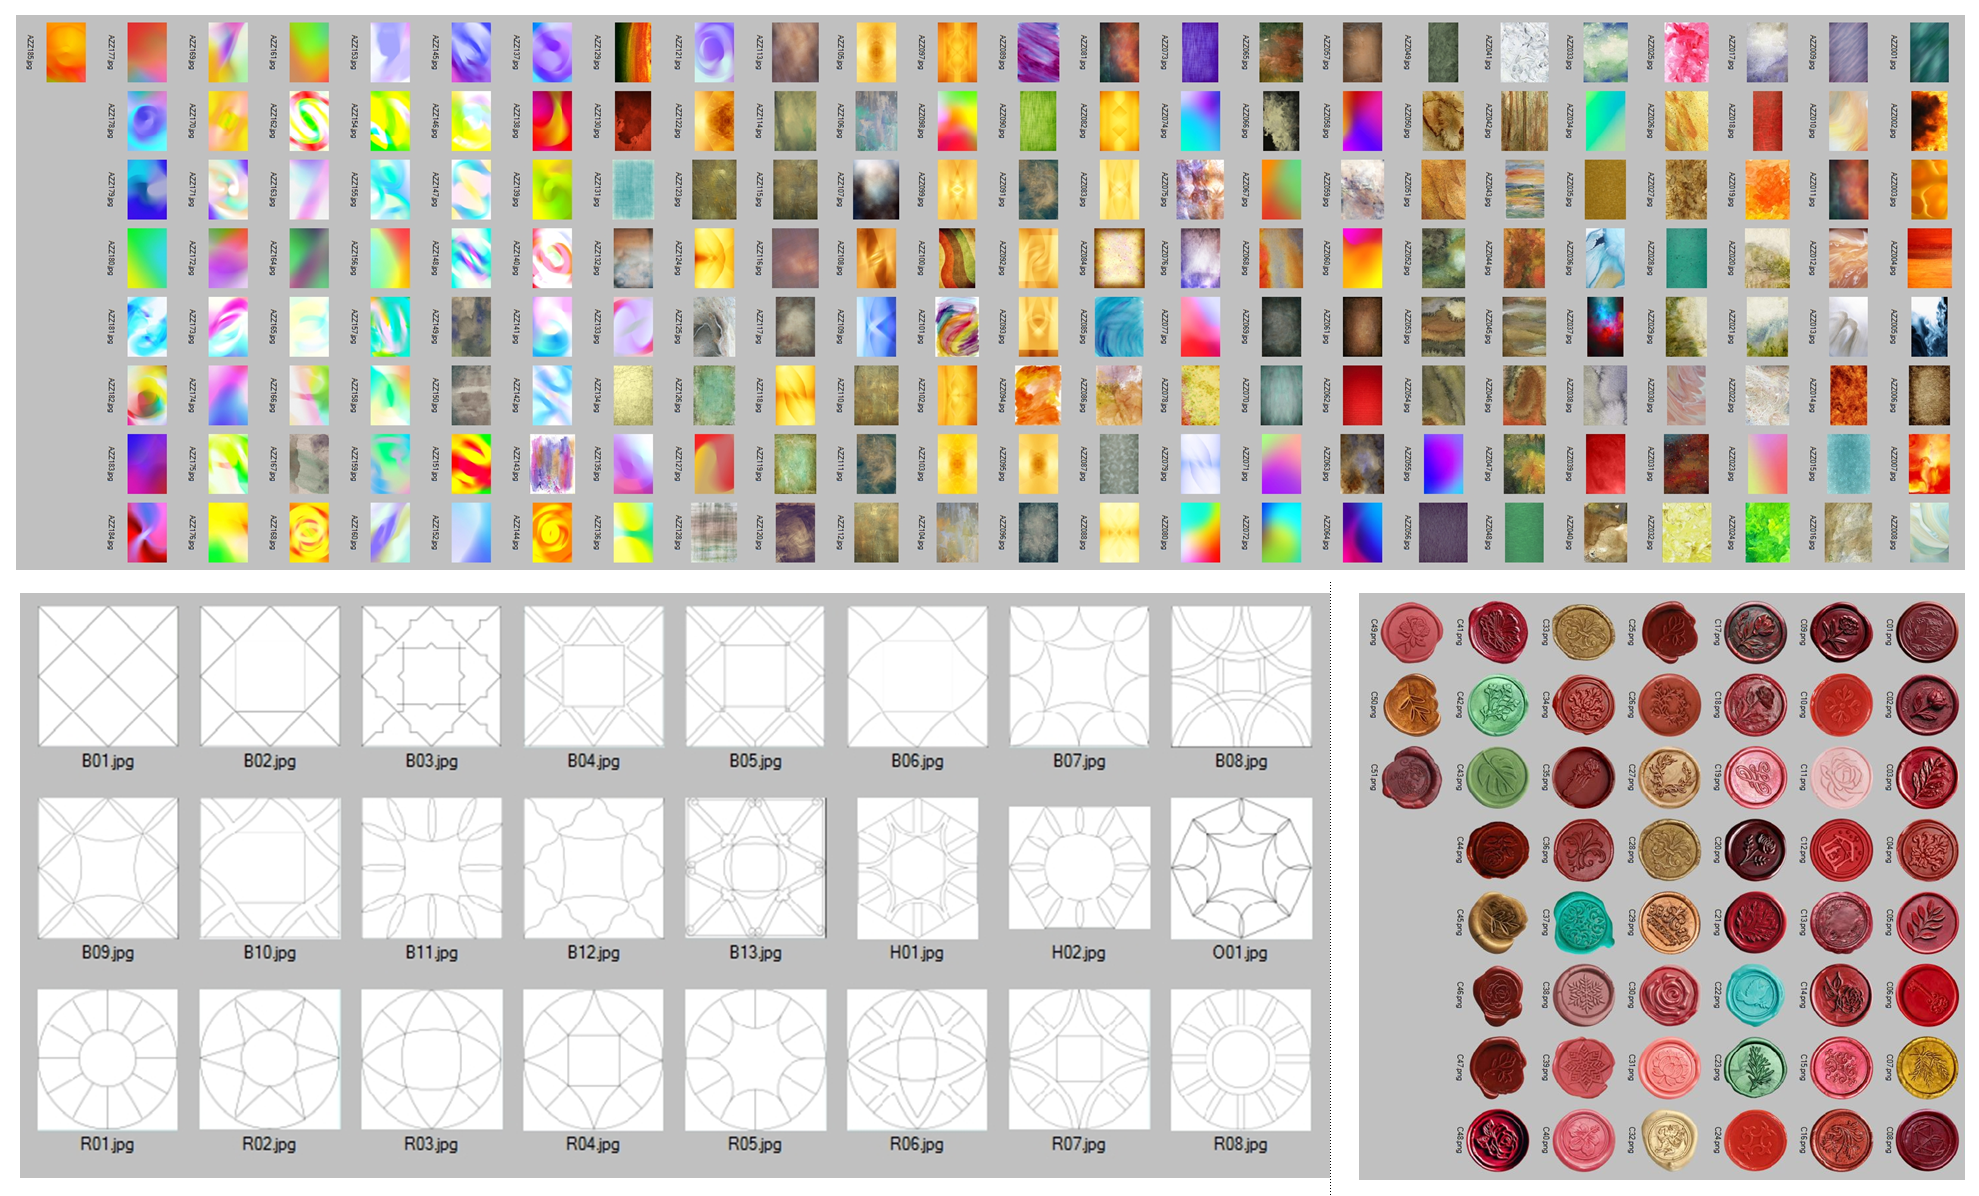 |
Example of part of an extended data set. The image displays groups of thumbnails of backgrounds, seals, and chart views from the expanded dataset. |
Screenshots of the ChartConductor module
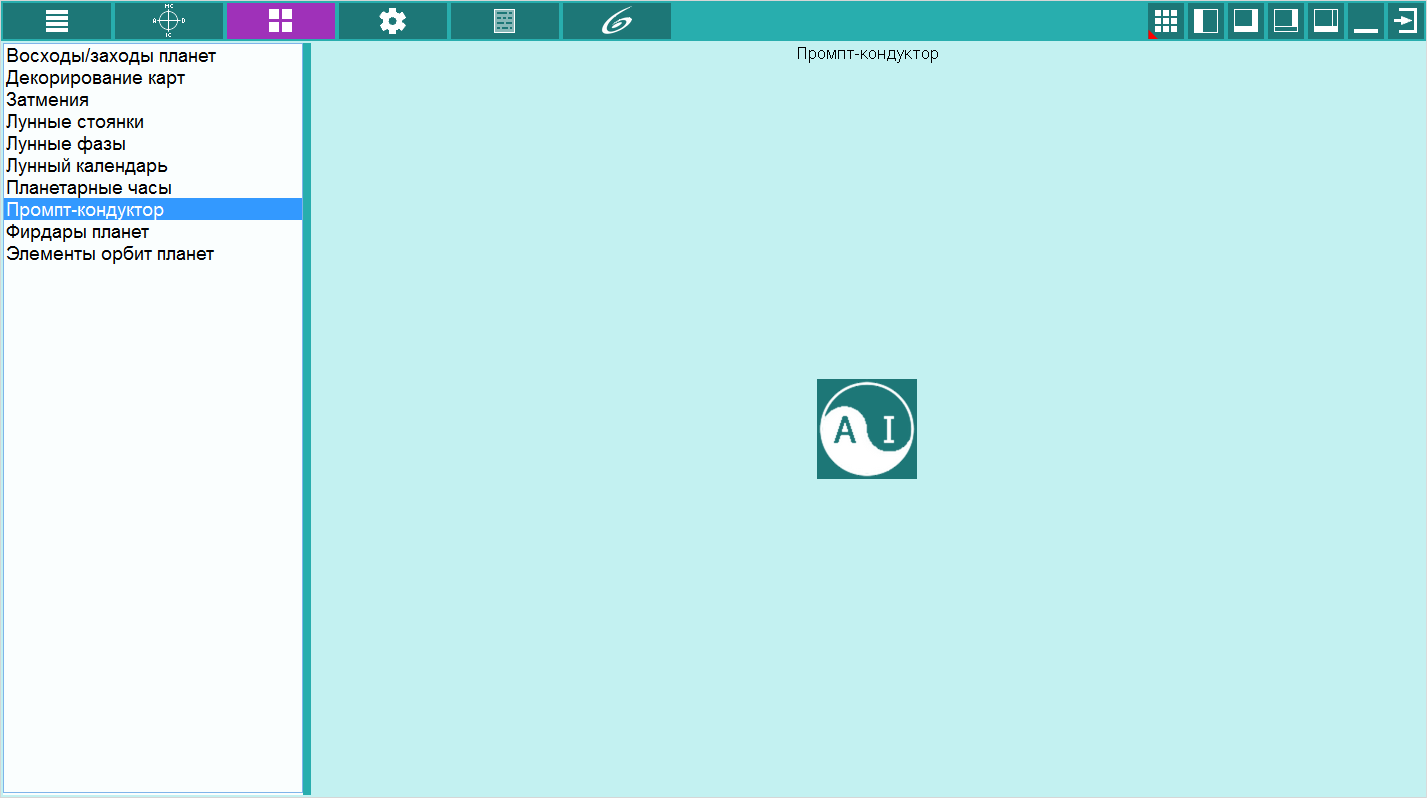 |
Expansion modules page. To open the ChartConductor module, you must select the "Prompt-conductor" module from the list of modules and click the "Open module" button. |
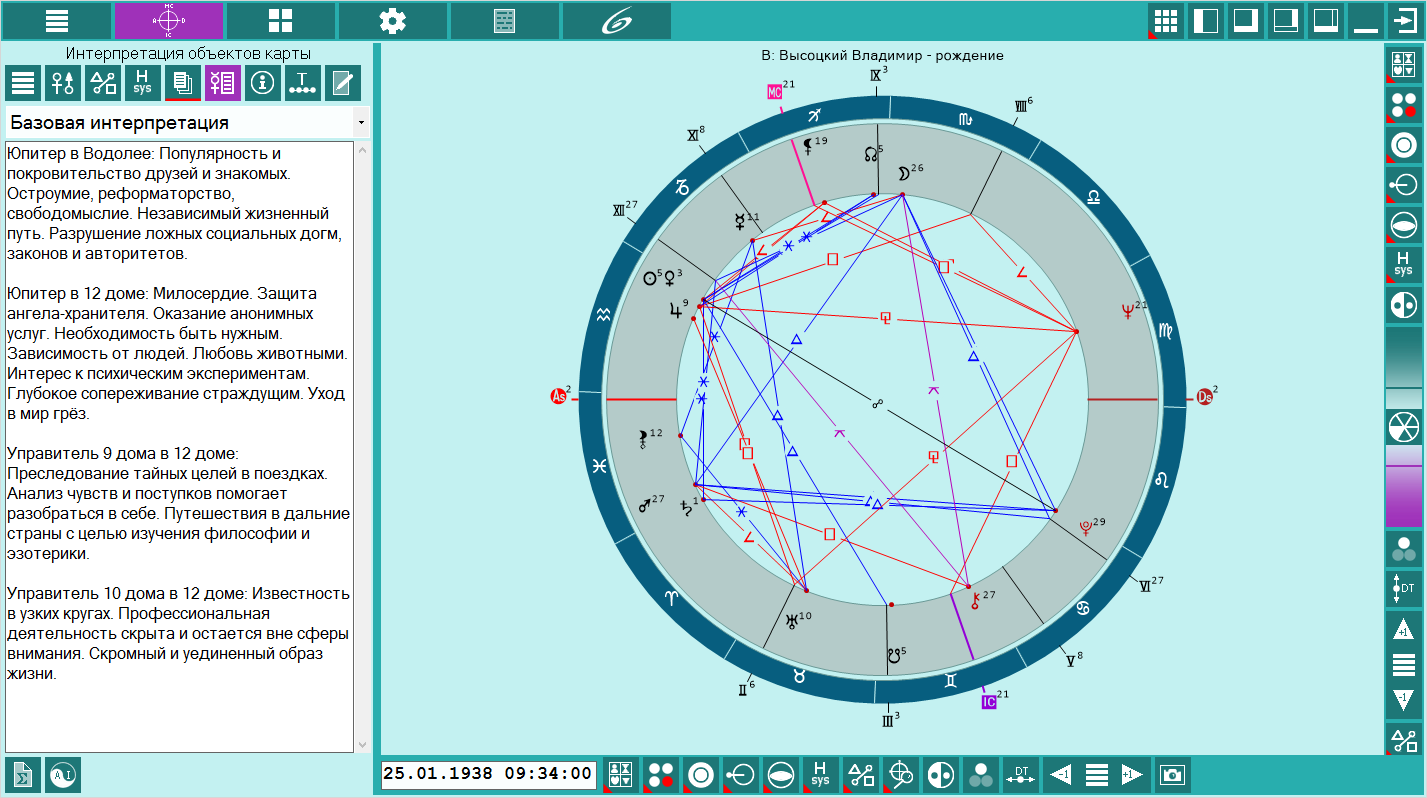 |
Opening a module. To open the ChartConductor module, click the "Prompt Conductor" button at the bottom of the object description element. |
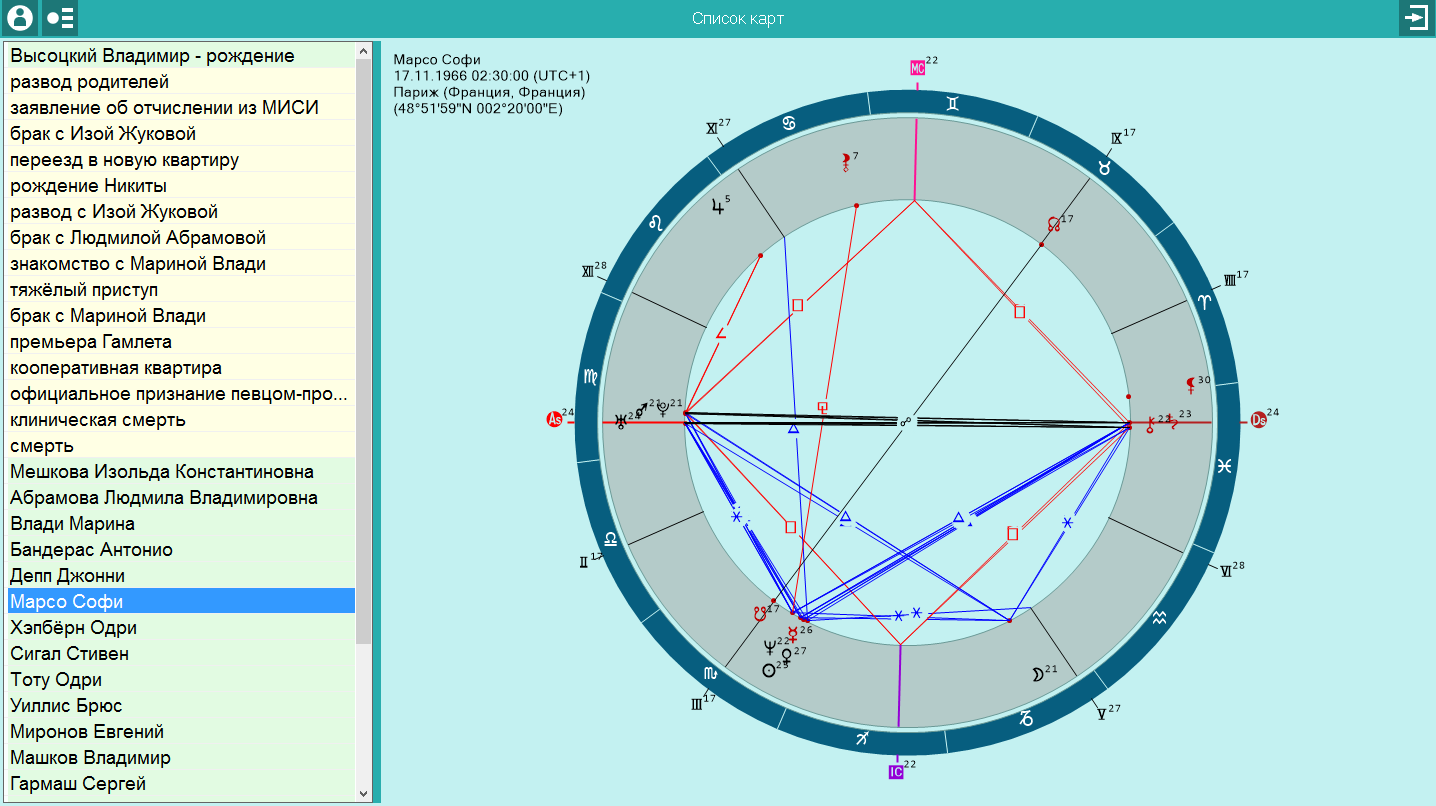 |
List of charts. To prepare a prompt, you need to select the desired chart from the list and go to the “Preparing a prompt and requesting an AI chat” screen. |
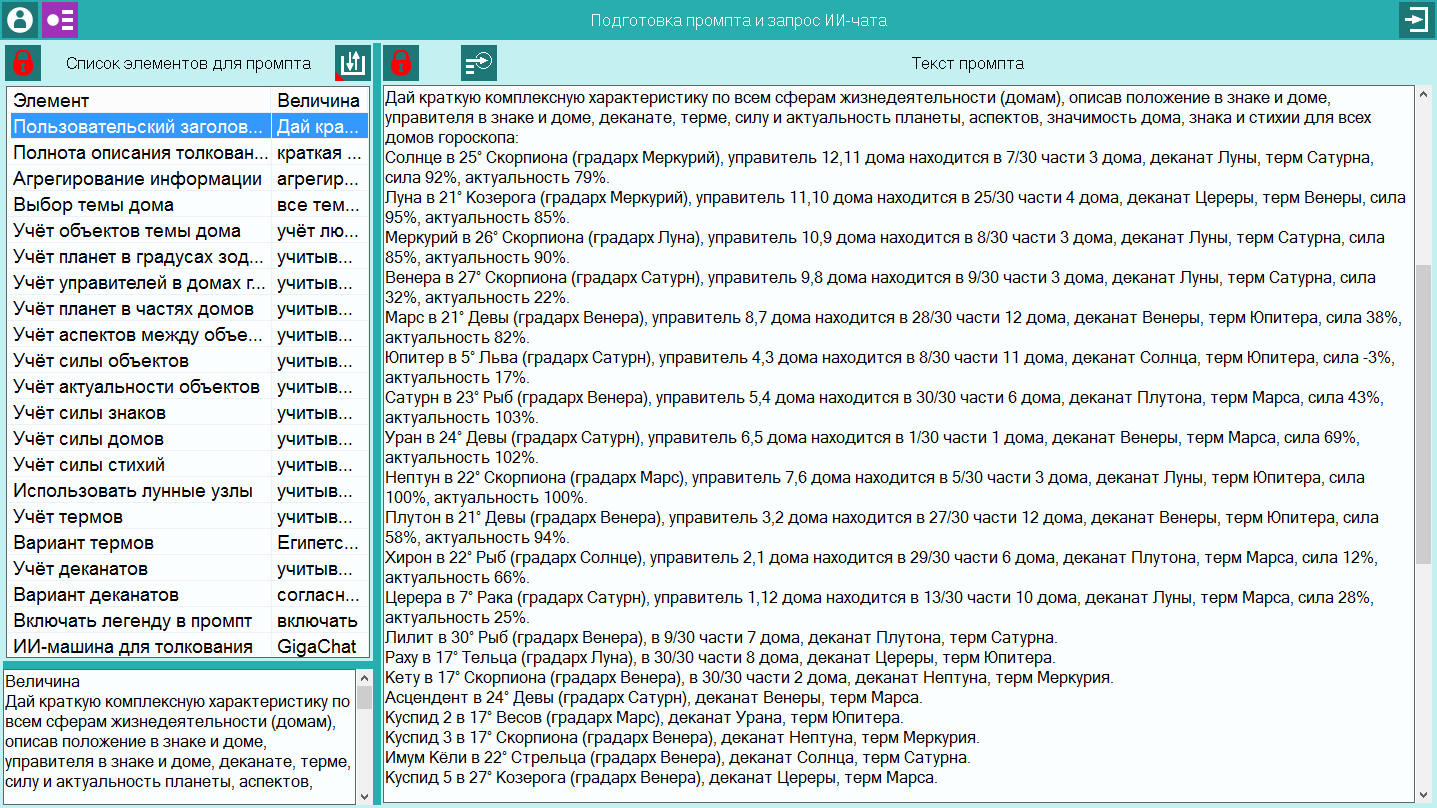 |
Preparing a prompt and requesting an AI chat. This is the main screen for working with the module. From it you can:
|
 |
AI chatbot response. Paste the prepared prompt request into the chatbot window and receive an answer to your request. This answer can then be copied and, if necessary, edited in the editor. |
Load (download) resources for Astrological program
- Promo clip Charts - Astrologer's basic universal tool
- Video-instruction for work with Charts
- Video-instruction for work with Charts. Part 2 - new features
- Video-instruction for work with Charts. Part 3 - new features
- Video-instruction for work with Charts. Part 4 - new features
- Video-instruction for work with Charts. Part 5 - new features (20240525)
- Galaxy programs - new features. Update (20241217).
- Galaxy programs - new features. Update (20250927).
- ChartDecor - Chart decoration module. Version (20251225).
- Galaxy programs - new features. Update (20260327).
- Galaxy programs - new features. Update (20260429).
- Video-lessons on work with program elements
- Getting Started with Galaxy
- Learn Galaxy. Video lessons
- How I do it. Practical astrology lessons with Galaxy
- Videos on Galaxy astrology programs on the Internet
- Help file for Charts
- Databases and thematic sets
- Other Resources of site

