Aspectarium - Aspect Analyzer (Galaxy.Aspectarium)
 Astrological program Aspectarium (Galaxy.Aspectarium) is a specialized astrological program that allows you to work with aspects as elements (atoms) of charts. Aspects mean not only angular aspects, groups of parallels or antises, but also aspects to a selected point, ingressions, as connections with the initial degree of a sign or house, as well as connections with points of change of direction.
Yes, almost all programs work with aspects, but how they work and what they do depends heavily on the essence of the program. Many astrologers are accustomed to disassemble the elements of astrological charts to bricks, to atoms, consider tables with individual elements, since their programs or those programs on which they were taught do not have the ability and ability to analyze. It may be right to study, but still the ultimate goal of an astrologer is the synthesis of a horoscope and the reconstruction of the picture as a whole, and not its decomposition. Therefore, Galaxy programs allow you to get the final, generalized version of any analysis. But here's how they do it, for many it seems to be a "black box". This is correct, because there is no need, having a program, to perform complex calculations or carry out time-consuming analyzes yourself, especially since many do not have such knowledge and do not represent how to do it.
Numerous representations of objects and points of the map with their aspects, allows the astrologer to immerse yourself deeply into the world of aspects and the map itself, reduce the time of analysis and search for the necessary points. All this is aspectarium.
Like all galaxy astrological programs, Aspectarium received many advantages from of the Galaxy astrological programs and is capable of interacting with it.
Additional information about program
- Unique features of Aspectarium
- Functional capabilities Aspectarium
- Screenshots and their brief description:
- Data entry;
- Data analysis. Search mode - aspects for objects;
- Data analysis. Search mode - aspects to the point;
- Data analysis. Search mode - ingression of objects;
- Data analysis. Search mode - position of objects;
- Data analysis. Search mode - direction of movement of objects;
- Data analysis. Search mode - objects without the course;
- Examples and reports.
- System requirements for the program
- Download resources
- Work methods and recommendations
- Video files
- Frequently asked questions
- Project participants in the personal contribution order
- Cost Aspectarium
- Prices
Unique features of Aspectarium
Astrological program Aspectarium is a unique program in the market of astrological programs, since it is a specialized program for the search for various kinds of phenomena in their various combinations in the following modes of work:
- Transit phenomena (without taking into account Natal) - allows you to search for transit phenomena;
- Event phenomena (taking into account Natal) - allows you to search for event phenomena with various astrological tools in relation to the natal chart.
Phenomena are understood as the following:
- Aspects to objects - the search for various kinds of aspects taking into account their modifiers between the specified objects;
- Aspects to the point - search for various kinds of aspects taking into account their modifiers from objects-permissors to a given point;
- objects of objects - the search for the ingresses of selected objects in:
- zodiac signs;
- houses of the natal chart;
- proted points.
- The position of the objects - the search for the provisions of objects in:
- sector of longitude;
- zodiac sign;
- house of the horoscope.
- Direction of the movement of objects - search for periods of finding objects in:
- direct movement (D);
- retrograde (backward) movement (R);
- period of stationary (S).
- Objects without the course - search for periods of finding an object without the course, taking into account aspect objects and specified aspects.
What unique features distinguish the Aspectarium program?
Let's dwell on the brightest:- search for phenomena with various astrological tools, and not just in transit;
- combining various phenomena in one search;
- preservation and loading of various search scenarios without reference to the search period;
- graphic representation of the points of ingress to signs, houses and specified points;
- instant display of the card and aspects at the given points of phenomena;
- interactive display of phenomena for the dates of the cursor date;
- use of the mechanism of time points that facilitate the return to the search points;
- integration with all Galaxy programs and the use of all the features of the Galaxy. programs.
Groups and Lines in the results of the search for phenomena
It is important to understand the essence that the search results are represented by groups and lines:- each group may contain N-linions;
- each line is atomarna and may contain N-results of the search for phenomena.
- group is one selected search mode (search for aspects, search for ingresses, etc.). More than one group in the search results can only be obtained in multimode. Each group can consist of n-lines. For example, major aspects from transit sun to transit Mercury and Venus;
- Line is one set of phenomena for one selected object, aspect, house or sign. For example, major aspects from transit sun to transit Mercury. The line is an atomary representation of phenomena for the selected search mode. If to display the results of the above search mode as the order axis (Y) the display of aspects is selected, then the line can be represented by a specific aspect.
Functional capabilities Aspectarium
| Operating modes |
|
| Search modes |
|
| Multimode | Multimode is available only if there is a module Multimode search for phenomena. This module allows you to create complex options for searching for phenomena with displaying results in many groups. Without this module, a simultaneous search is possible in only one search mode. |
| Work with charts |
|
| Astrological tools |
|
| Supported planes |
|
| Supported houses | 24 systems of houses, including 14 of the most common and 10 modern. |
| Zodiac type | Tropical - counting from the point of Aries (spring equinox) |
| Work with aspects | works with any aspects, including:
|
| Work with objects |
|
| Support for turning on objects in the charts |
|
| Loading and saving cards | Work with an unlimited number of data banks and an unlimited structure of the Bank itself |
| Support for time points | Unlimited number of time points |
| Support for the dynamics of charts | Support for the dynamics of charts of an external chart with various astrological tools. |
| Calculation of the temporary amendment | Taking into account alternative sources |
| Coordinates of the settlements | More than 16 thousand settlements (in the Locator program more than 3.5 million throughout the globe) |
| Chart these protection | Chart data protection from random changes |
Screenshots and their brief description
to view large-sized pictures, just click on the picture with the mouse.
Entering data
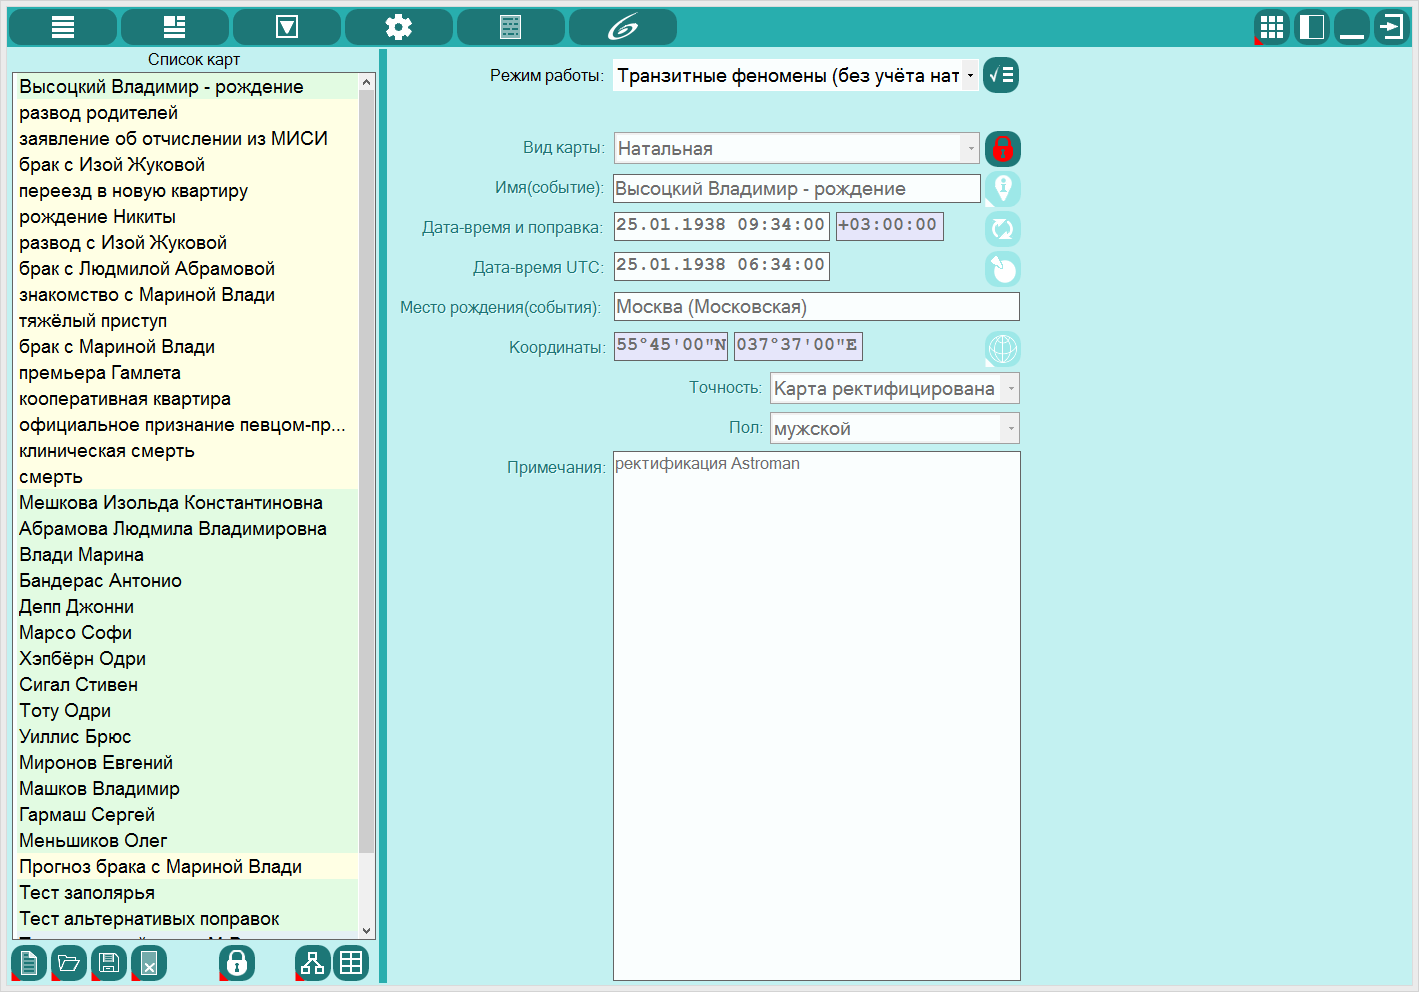 |
Important! Work on the creation, editing, saving, loading of charts, etc., is similar to all Galaxy programs that work with charts. This is standard programs Charts screens. |
 |
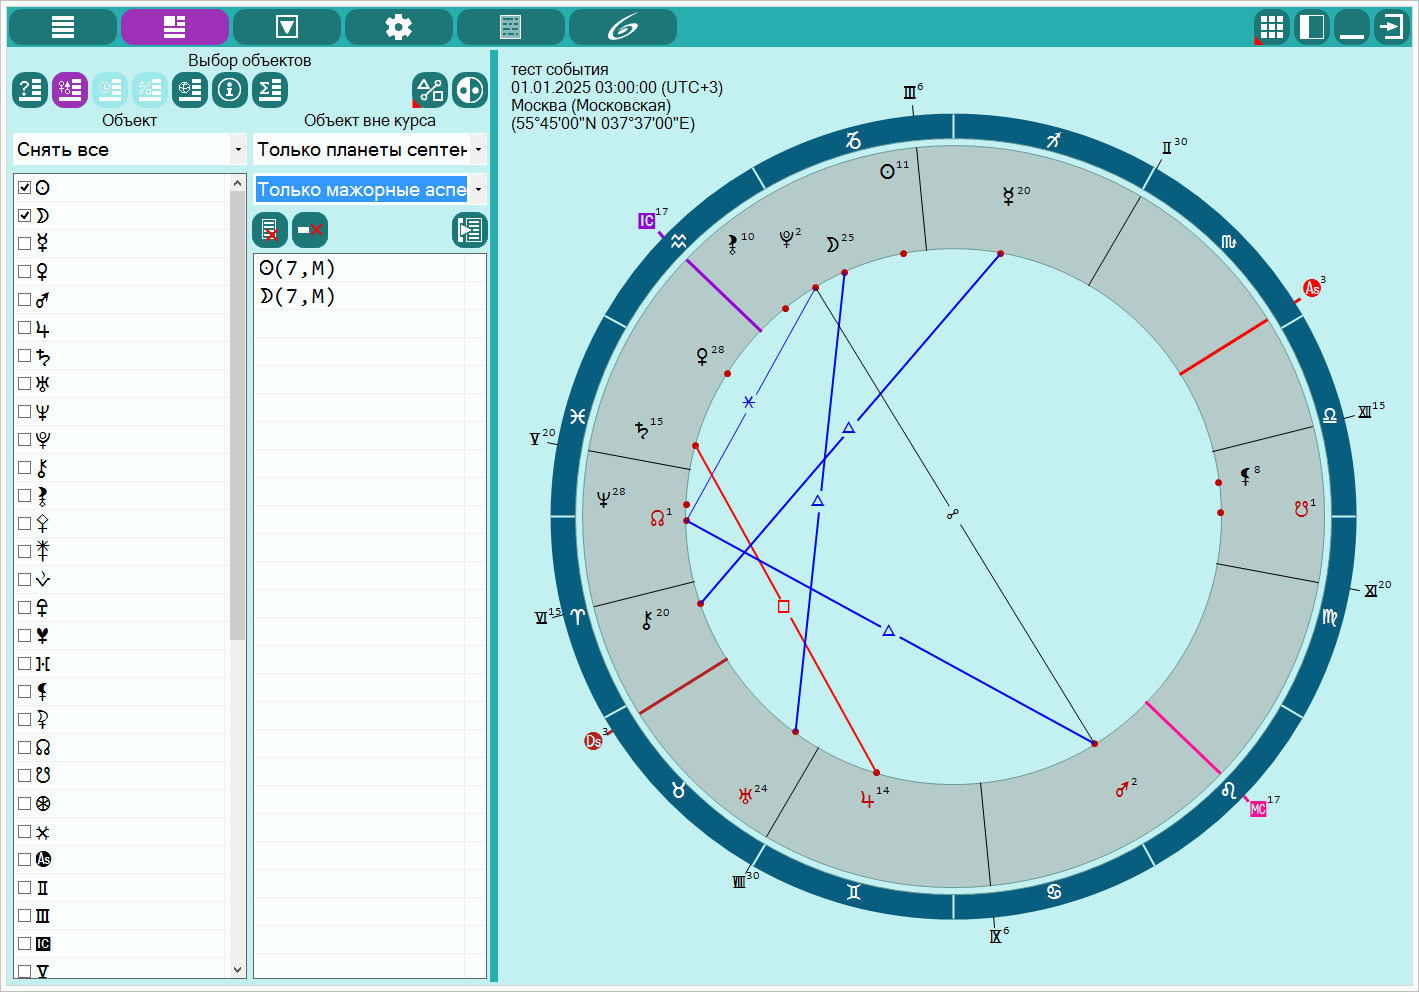
The mode of operation is transit phenomena. Single transit charts for the search for phenomena are involved in this mode of work. |
 |
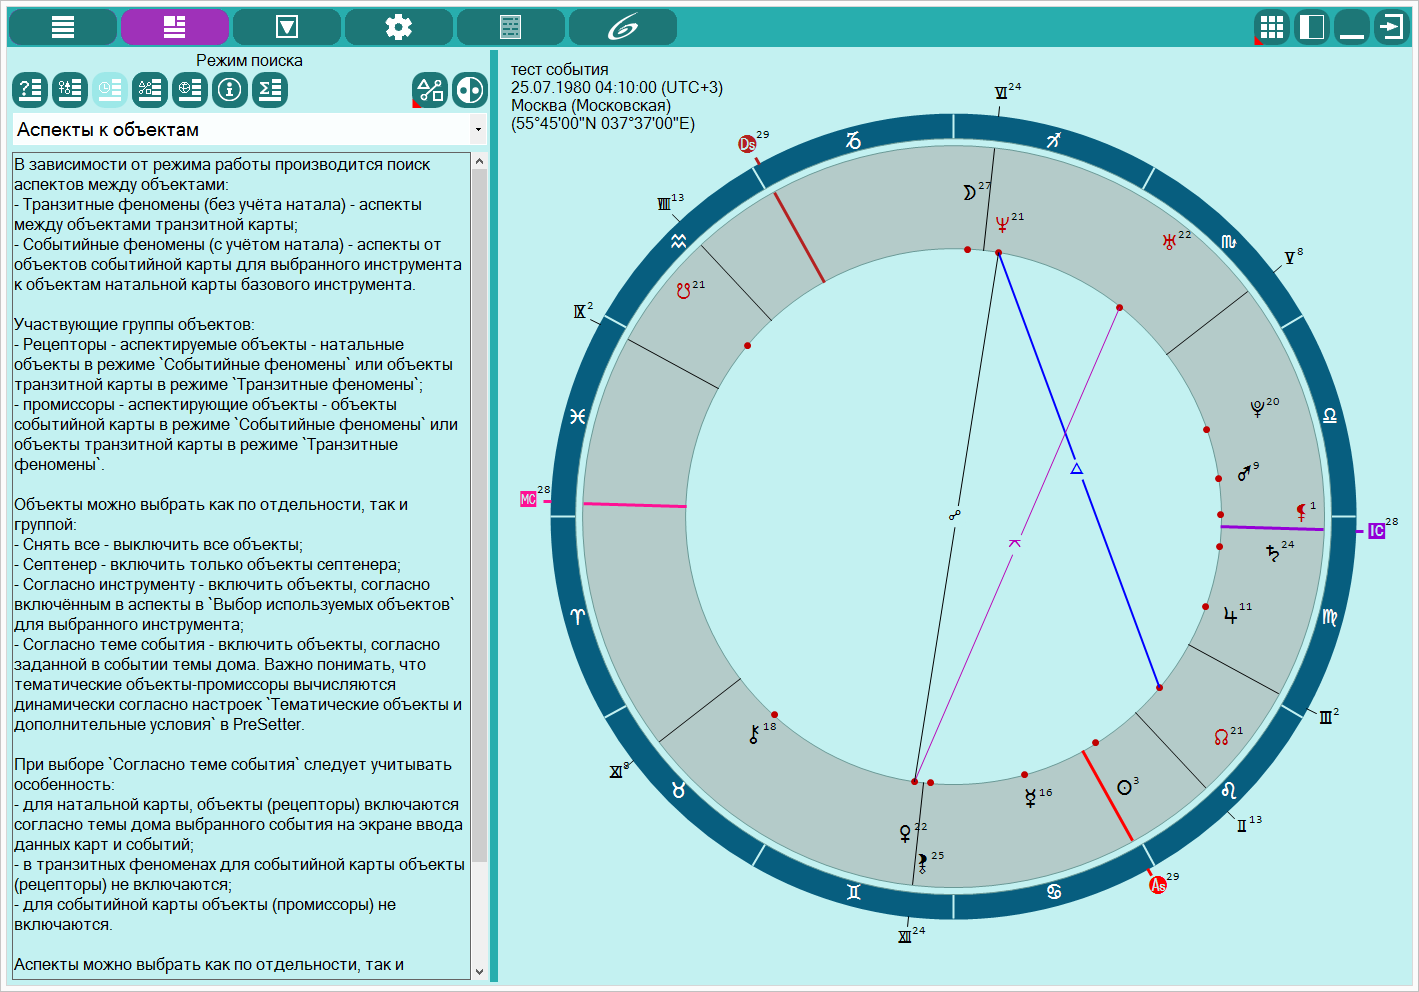
The mode of operation is event phenomena. Double charts are involved in this mode:
|
 |
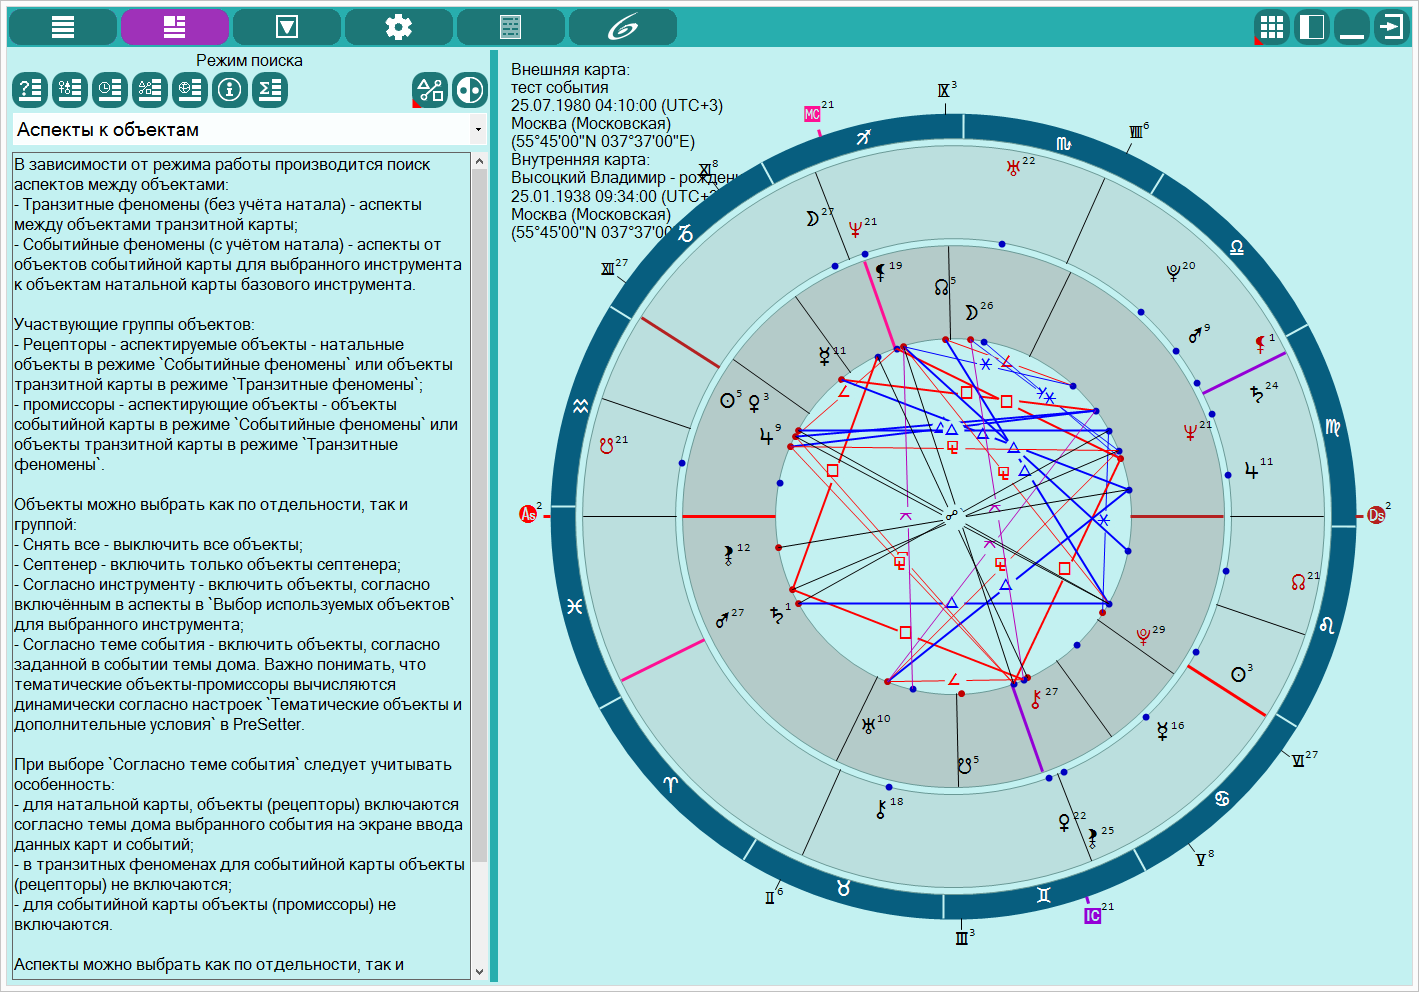
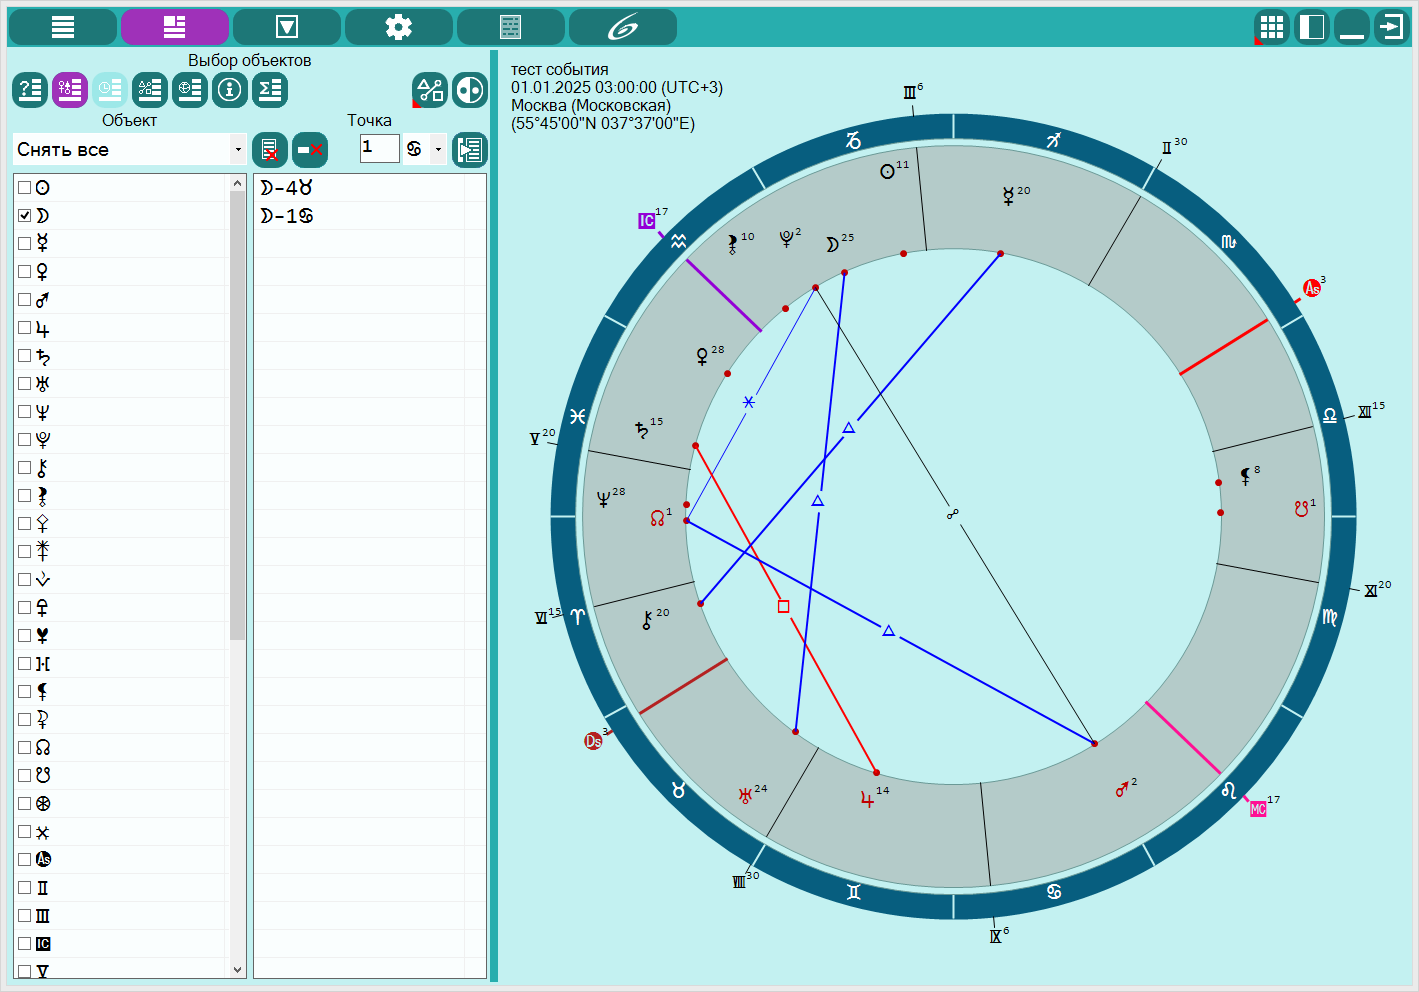
Entering additional data. Search mode - aspects for objects. Parting groups of objects:
|
 |
Entering additional data. Search mode - aspects to the point. Parting groups:
You can set the N-th number of points. |
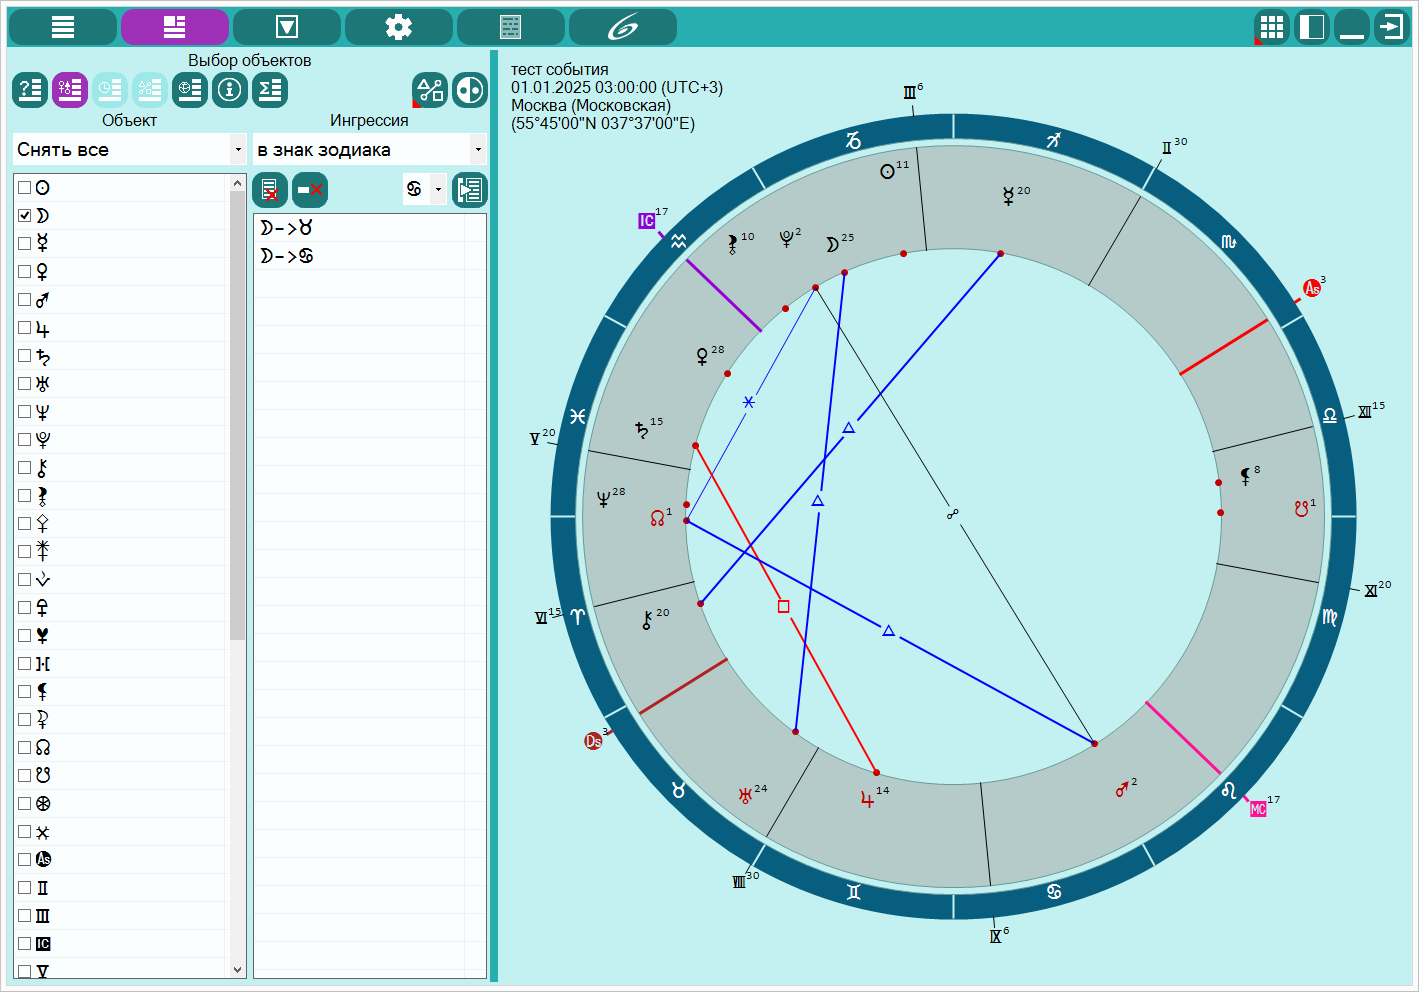 |
Entering additional data. Search mode - objects of objects. Parting groups:
|
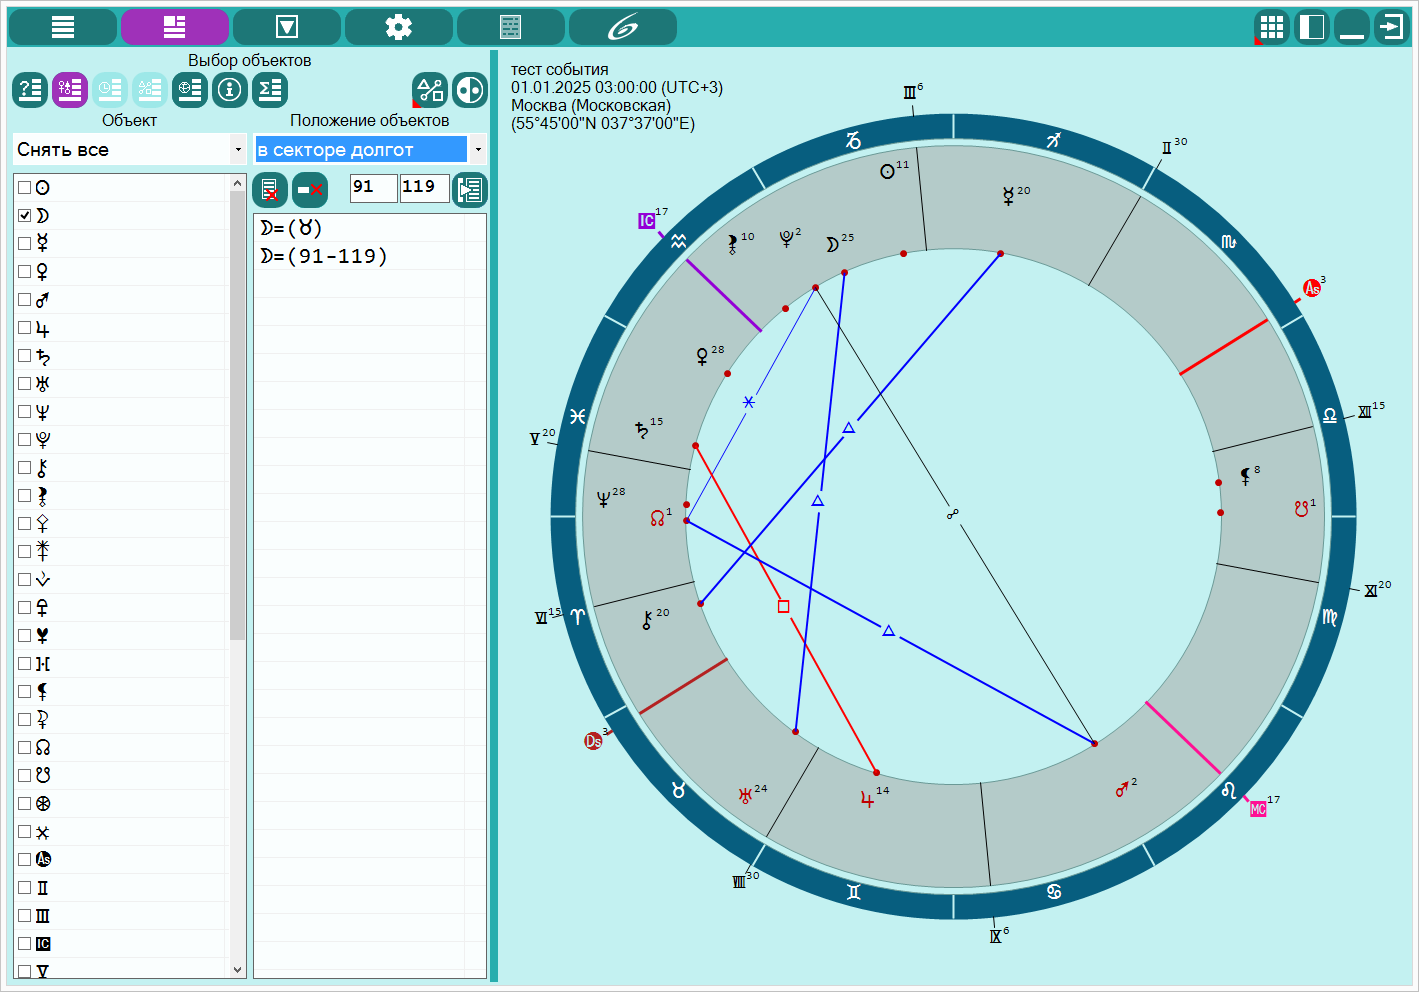 |
Entering additional data. Search mode is the position of objects. Search for periods of finding objects in the zones:
|
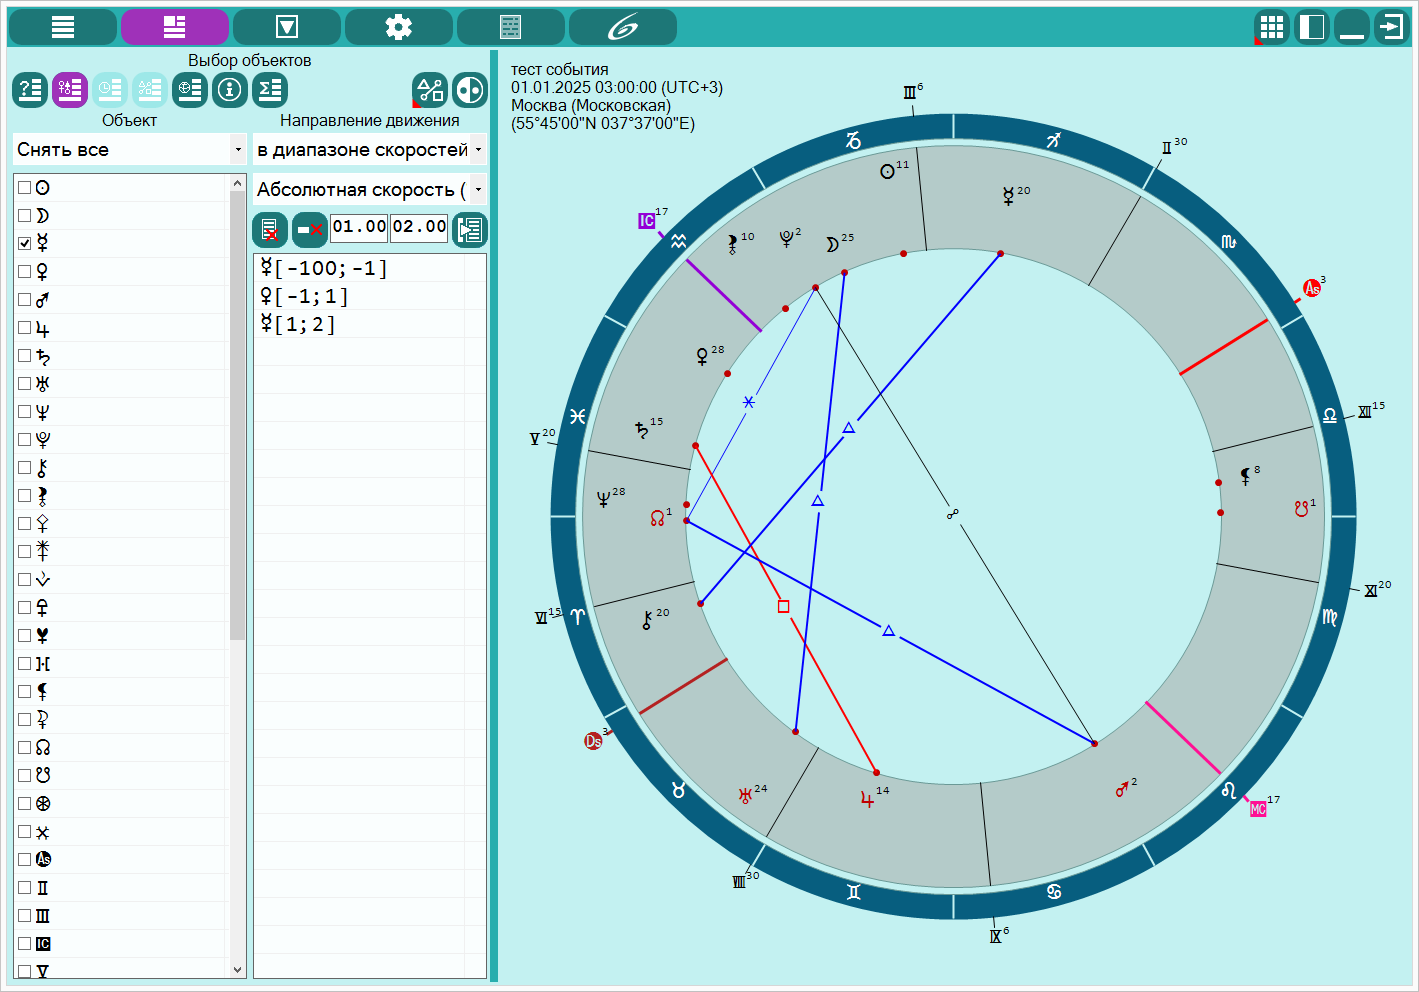 |
Entering additional data. Search mode - direction of movement of objects. Parting groups:
|
 |
Entering additional data. Search mode - objects without the course. Important! This search mode is available only in the `transit phenomena`! The search for periods of finding the object without the course, taking into account:
|
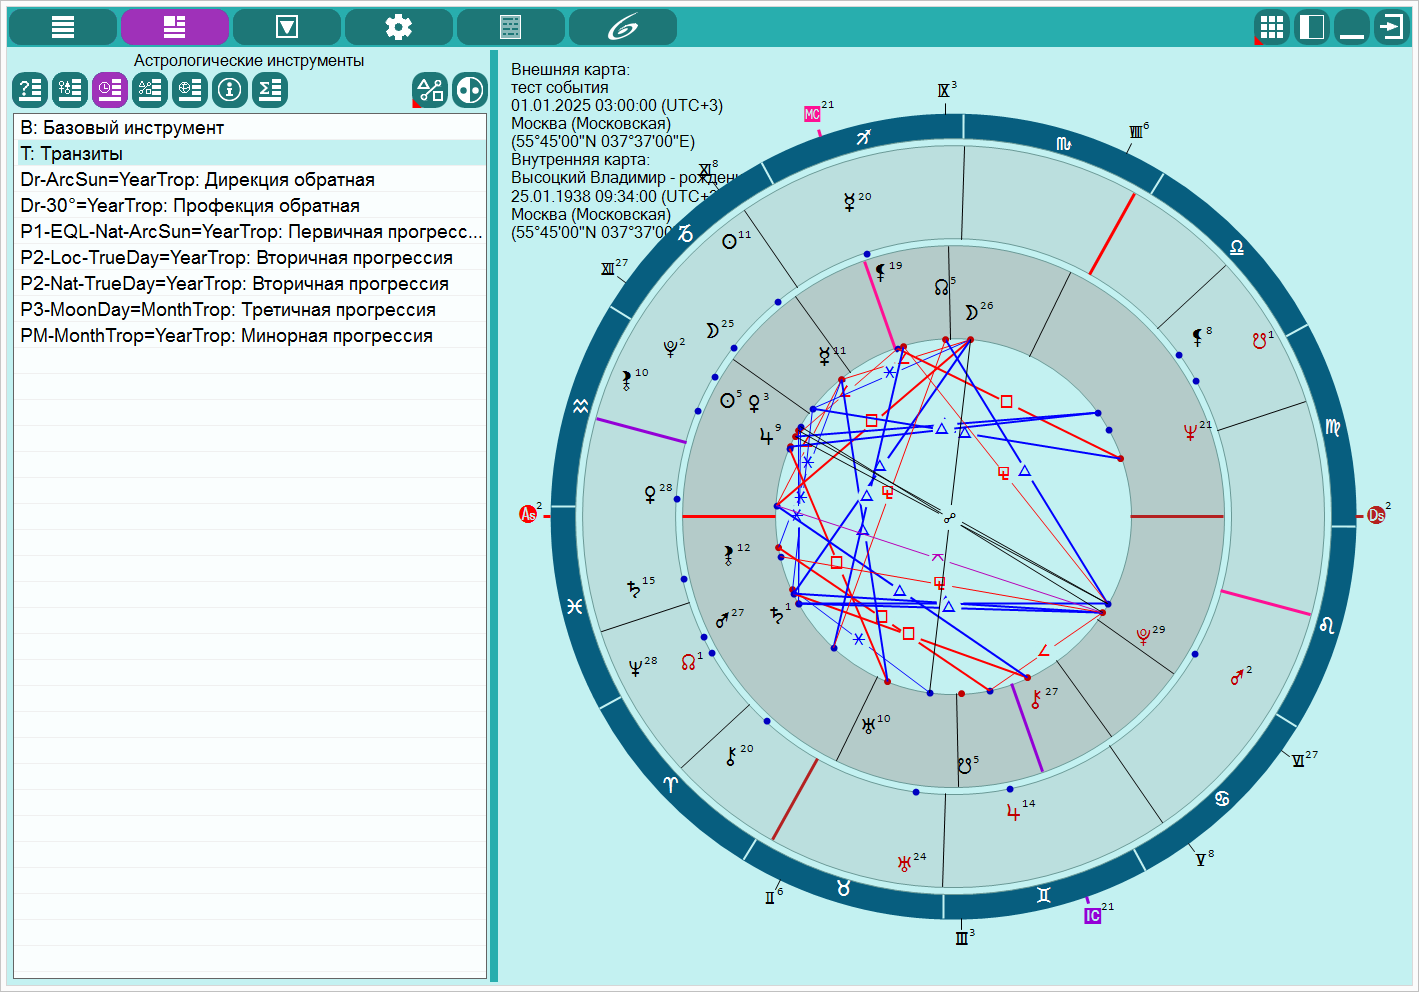 |
Entering additional data. Astrological tools Important! In the mode of operation, `transit phenomena` astrological tools are not available, since the `transit` tool is automatically set. In `Event phenomena`, all astrological tools are available from the Galaxy prognostic tools: directions and progressions. |
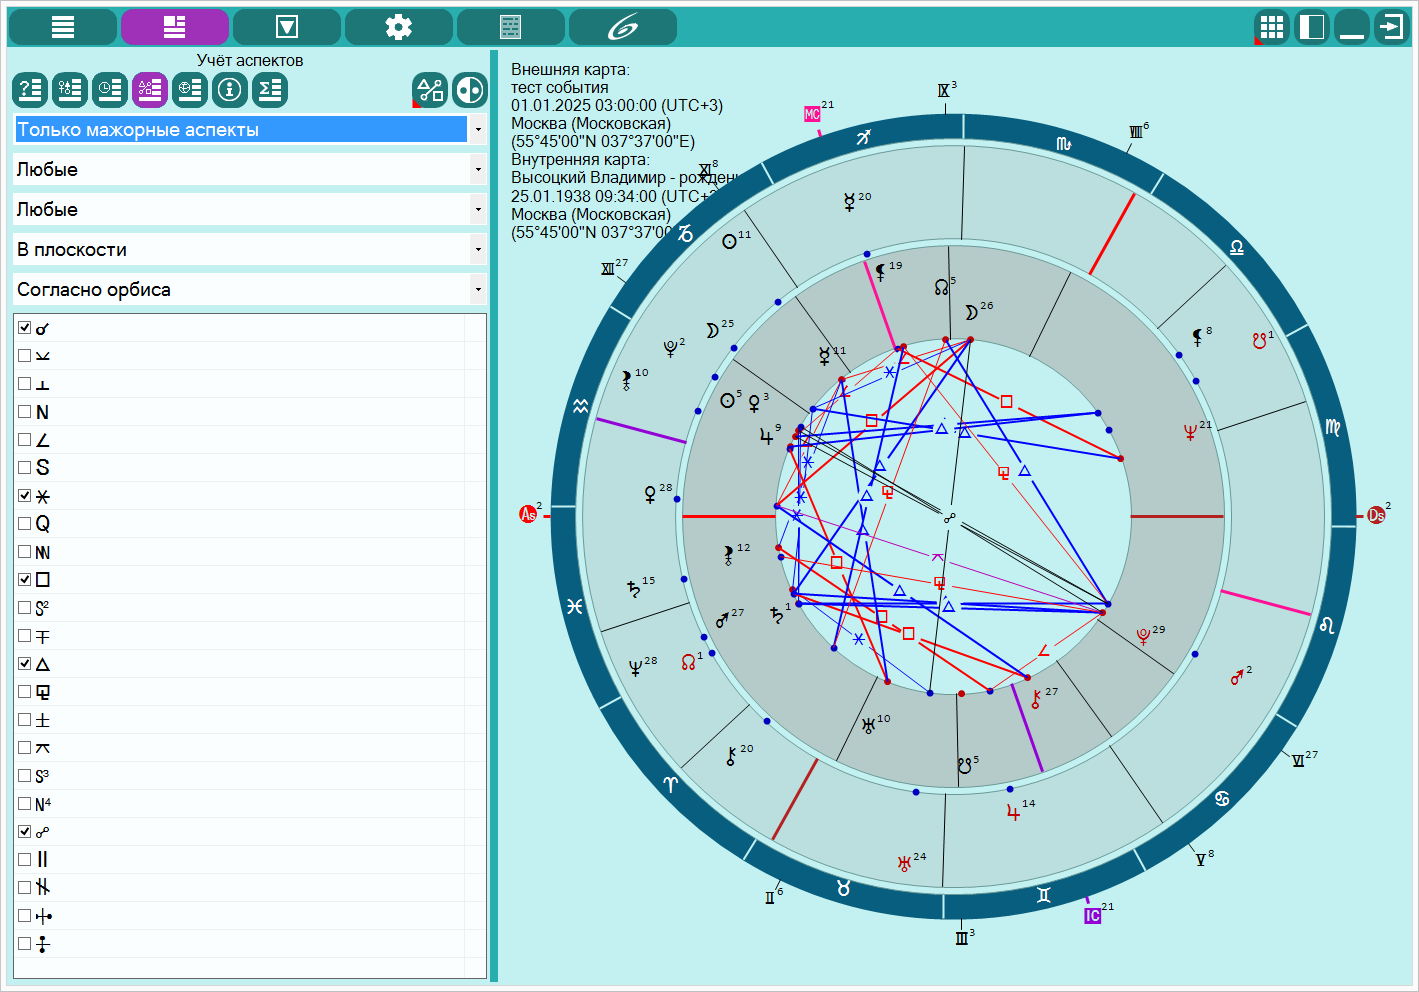 |
Entering additional data. Accounting of aspects. Important! Data for the input of aspects are available only for search modes:
|
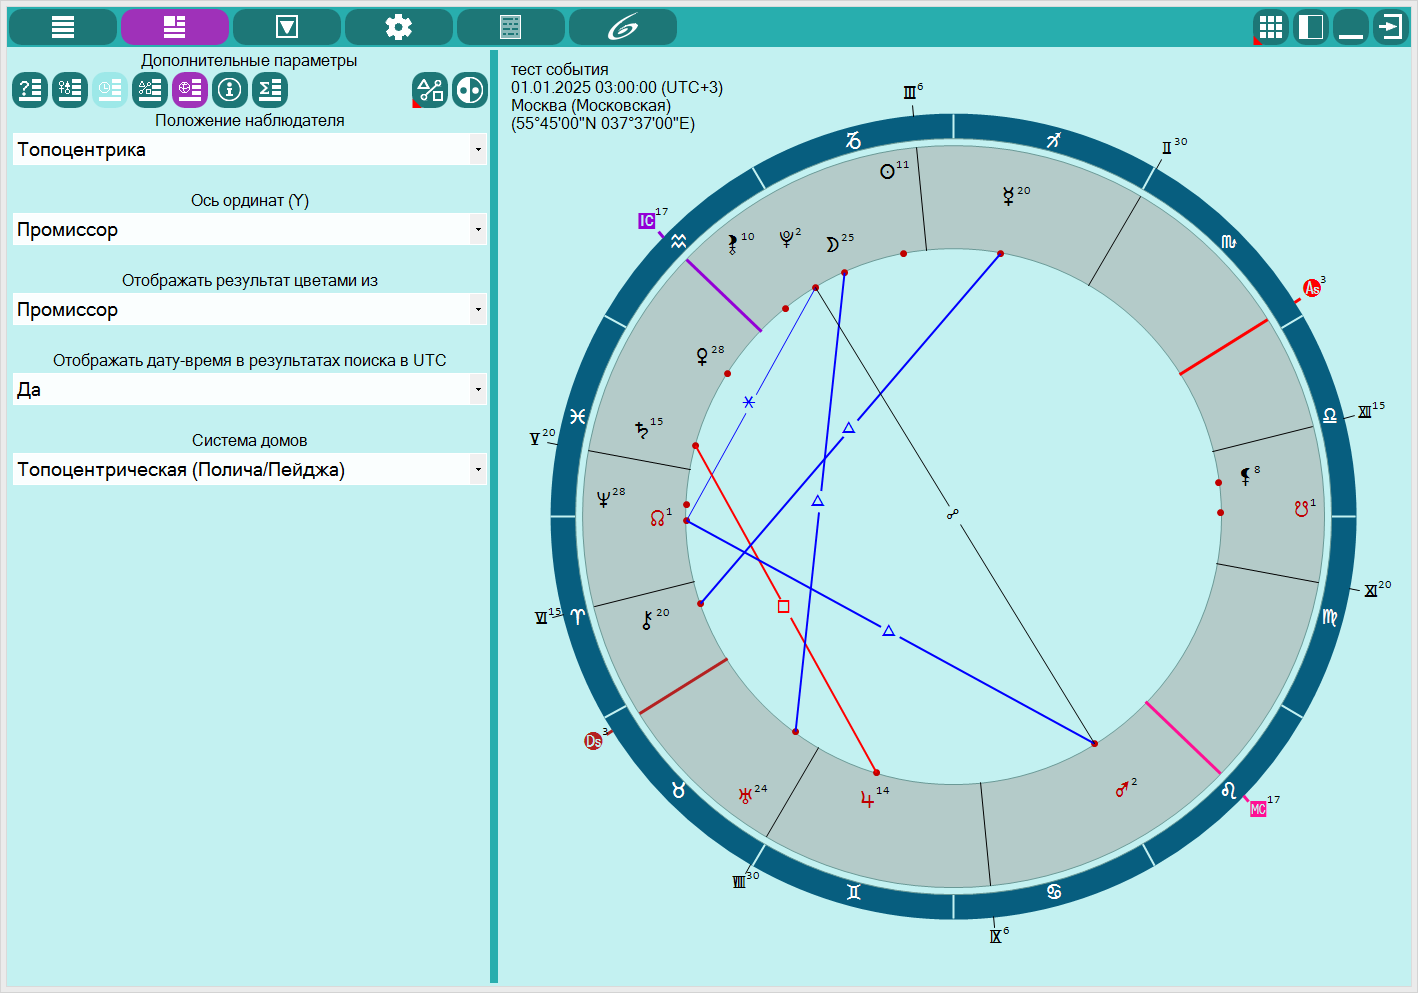 |
Entering additional data. Additional parameters. Additional parameters allow you to set:
The selector of the display of the result with color:
The selector of the selection of a system of houses. Sets the system of houses for the group. Important! Since in one calculation in several groups, you can set different systems of houses, then the choice of these systems affects only the calculations and display of results and does not affect global attitudes. |
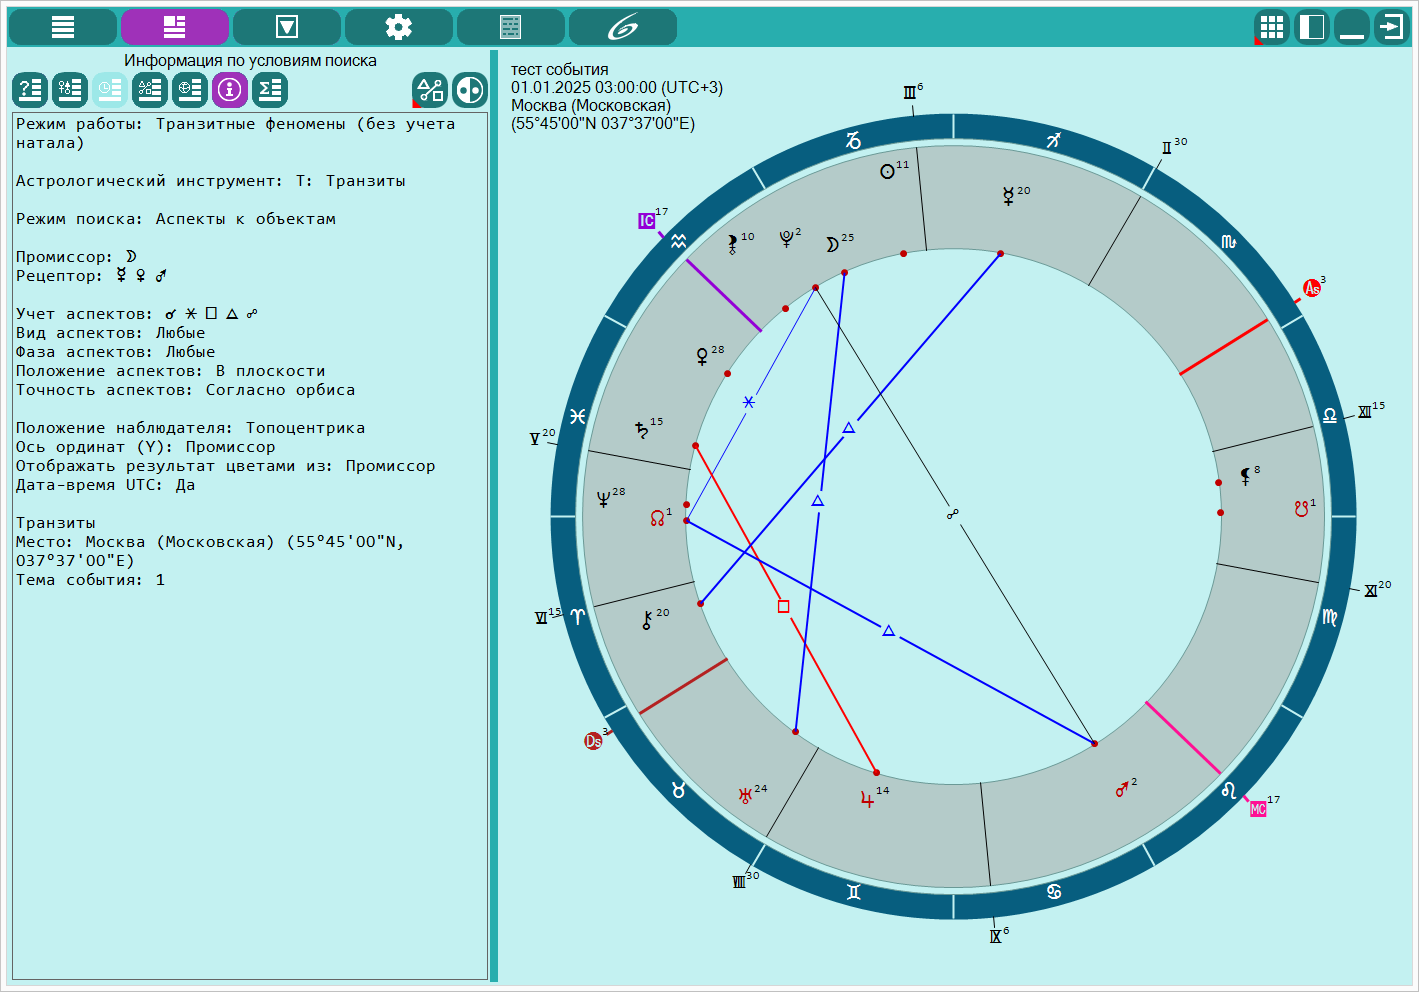 |
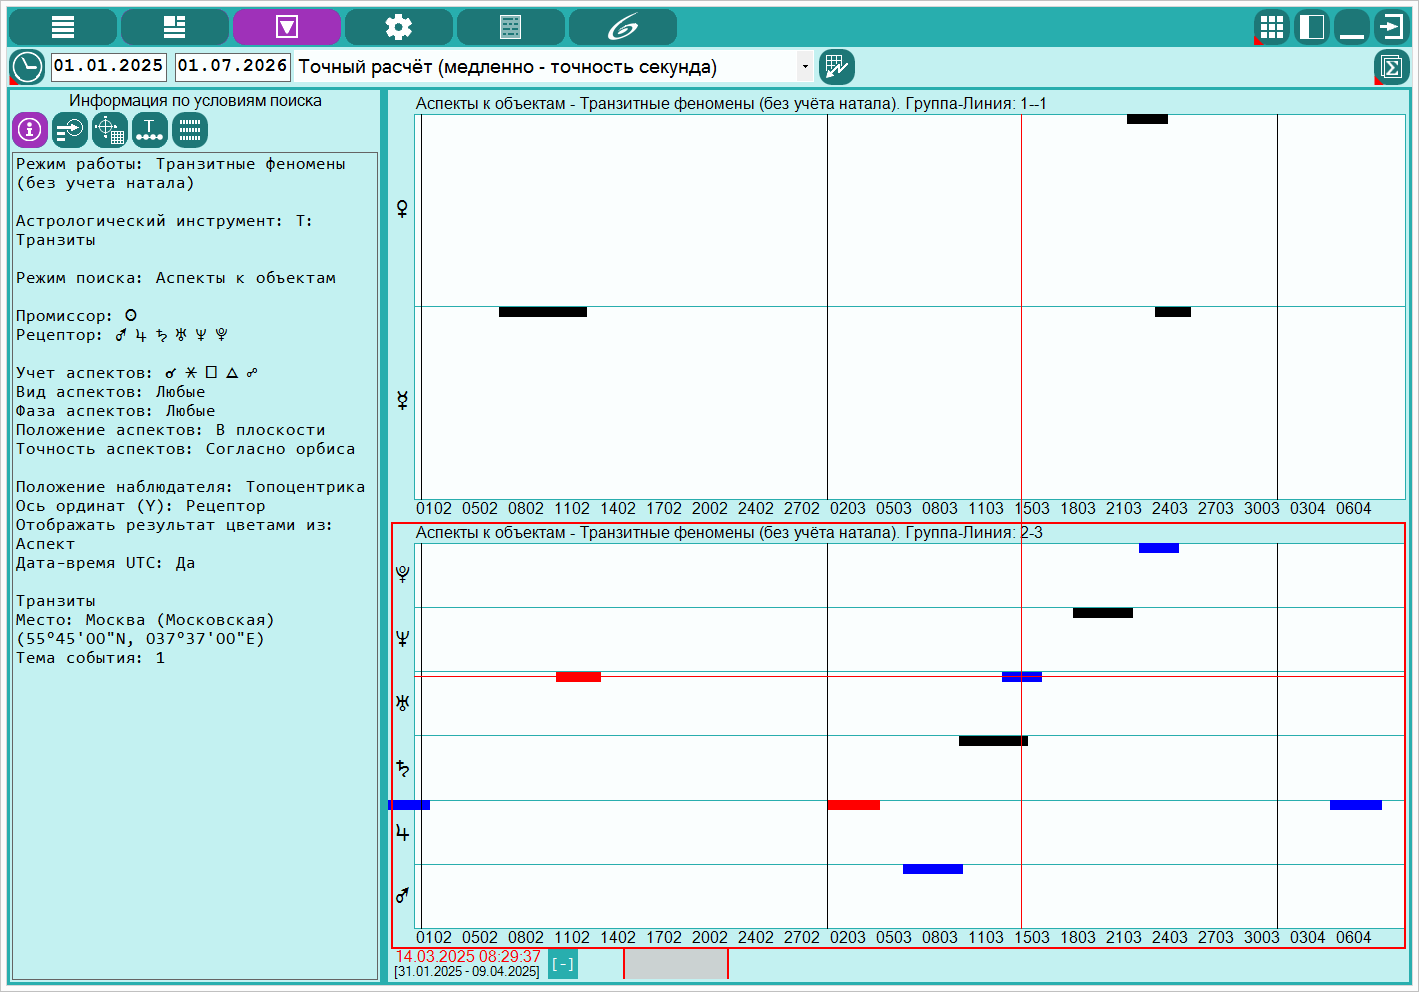
Entering additional data. Information on the search conditions. On this screen, in aggregated form, an infomination is presented according to the selected mode of operation, the mode and search conditions, as well as the additional data necessary to display the results on the screen. |
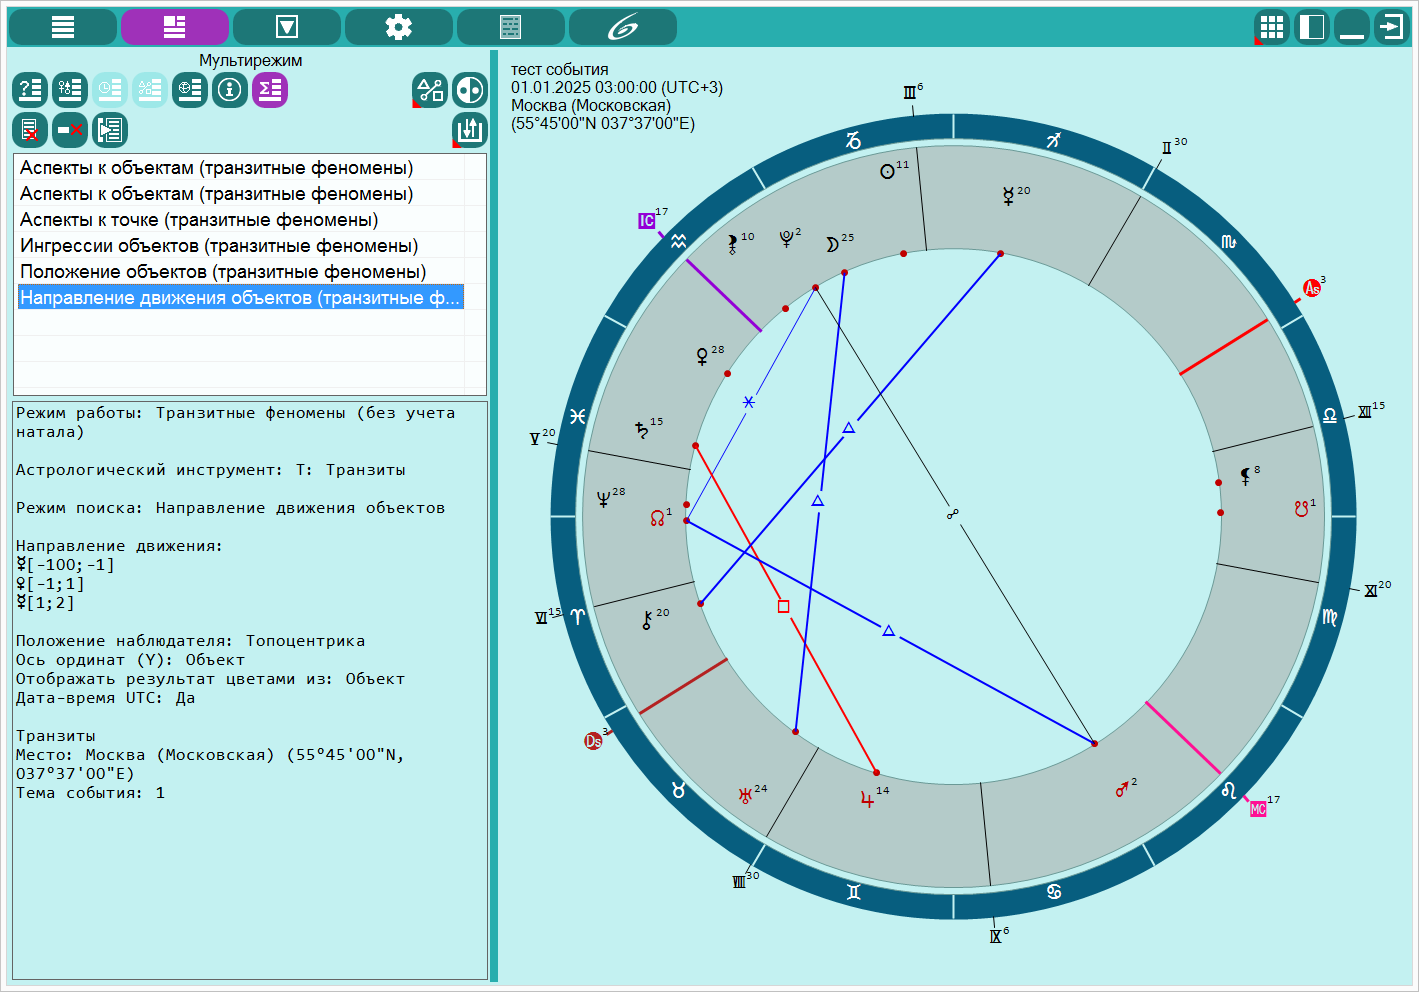 |
Entering additional data. Multimode. Important! Data for entering on this page is available only if there is a module `multimode searching phenomena`! Multimode allows you to create search groups that can contain not only different search modes, but also their various conditions. Those at the same time, various search modes can be displayed on the screen screen, which cannot be made without this multimode. In addition, from this screen you can save and upload the created search groups for subsequent work. Which greatly facilitates the search for phenomena. |
Data analysis. Search mode - aspects for objects
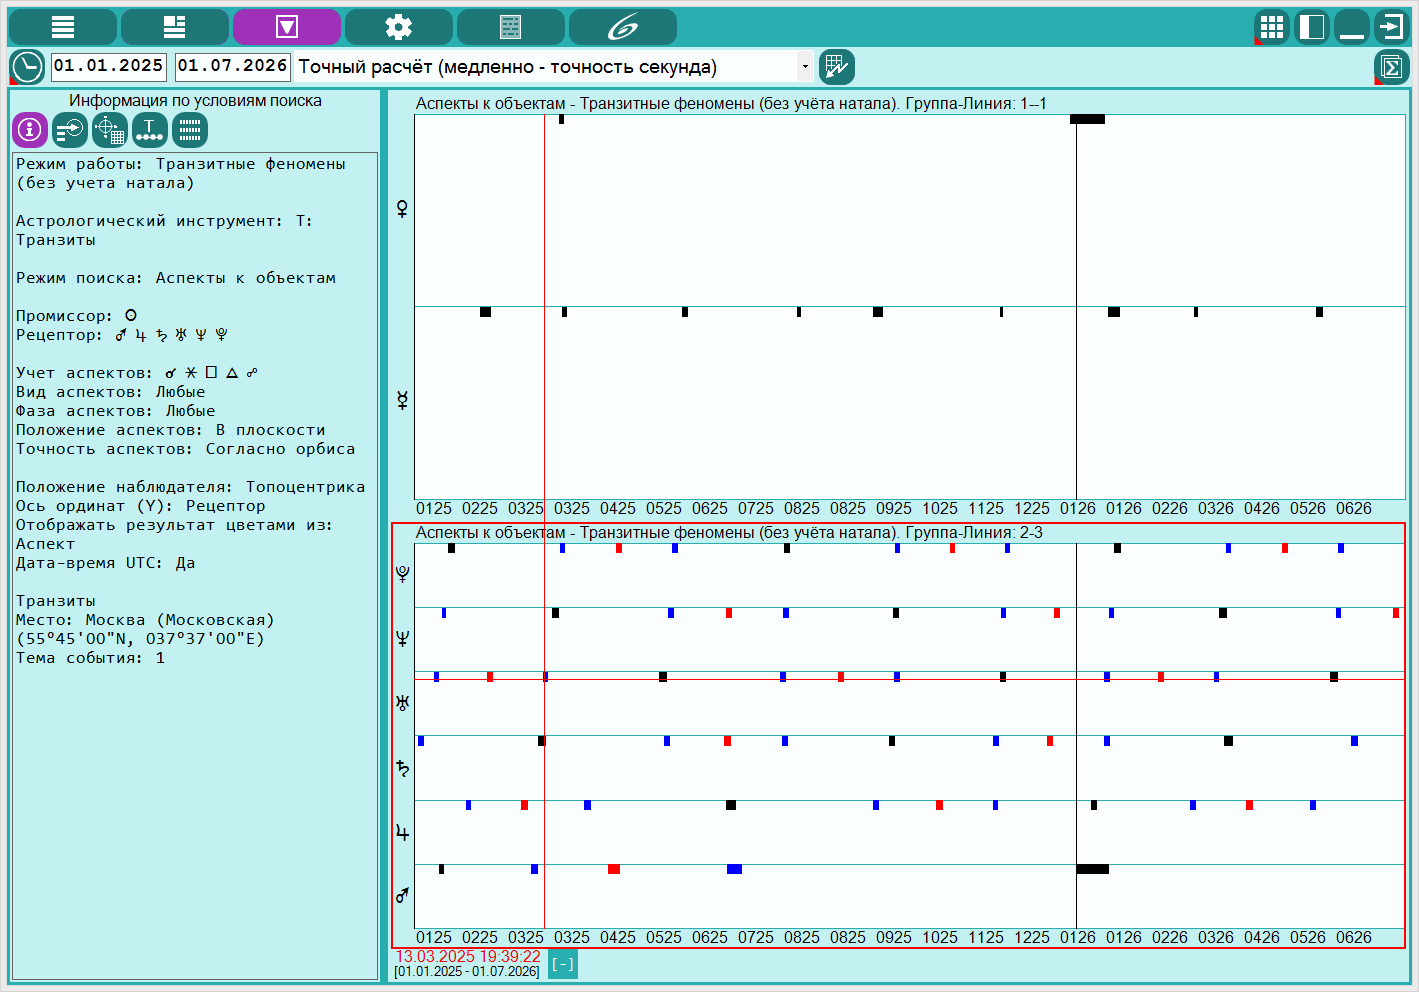 |
Data analysis. Search mode - aspects for objects. Information on the search conditions. The result of the search is aspects between objects. Depending on the mode of operation, the aspects of aspects between the objects are carried out:
|
 |
Data analysis. Search mode - aspects for objects. Scaling periods. After obtaining the results of the search for phenomena in a given period, you can scale the rear periods and thereby increase the scale of display of the results. Those displaying the reduced period (part of the period under consideration), You can increase the display of the result of the result on the graph. Thus, by increasing the scale of display, you can more accurately set the cursor on the resulting graphics. The scaling of the period is drawn with the clamping of the right mouse button and dragging the mouse cursor to the right to increase the mashstab of the display. While dragging the highlighted scalable period is painted with a shade of red. And after the scaling, the increased subordiod is displayed at the bottom of the screen with a shade of red, showing which part of the scalable period is displayed on the screen. |
 |
Data analysis. Search mode - aspects for objects. Scaling the search period of aspects. A return to the initial period under consideration is made when pressing a button displayed by groups at the bottom of the screen, next to the temporary period and a temporary point. |
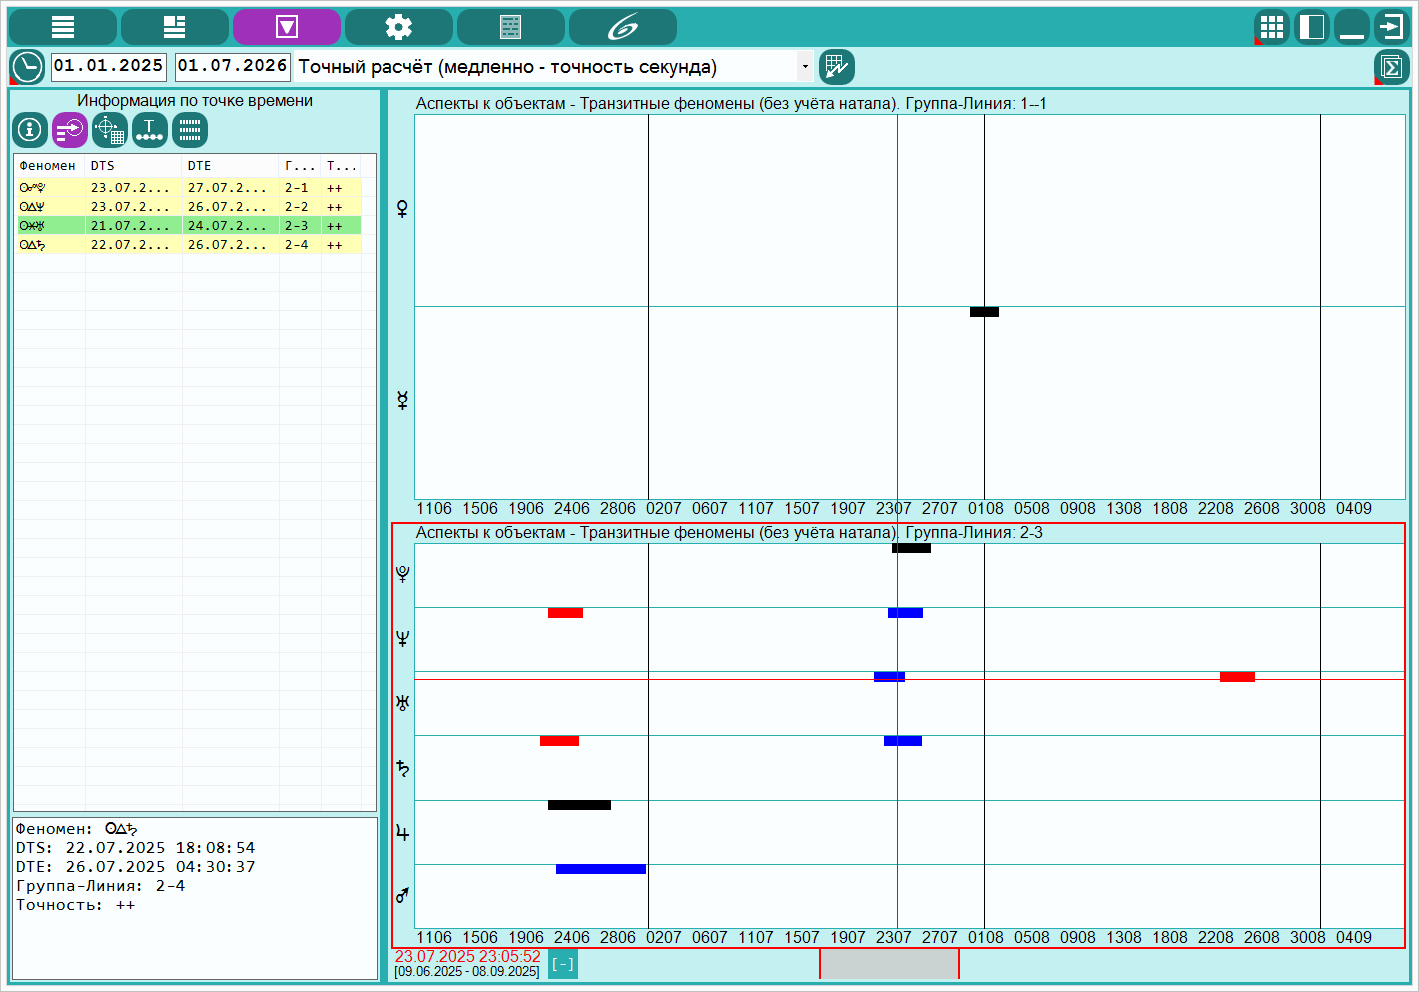 |
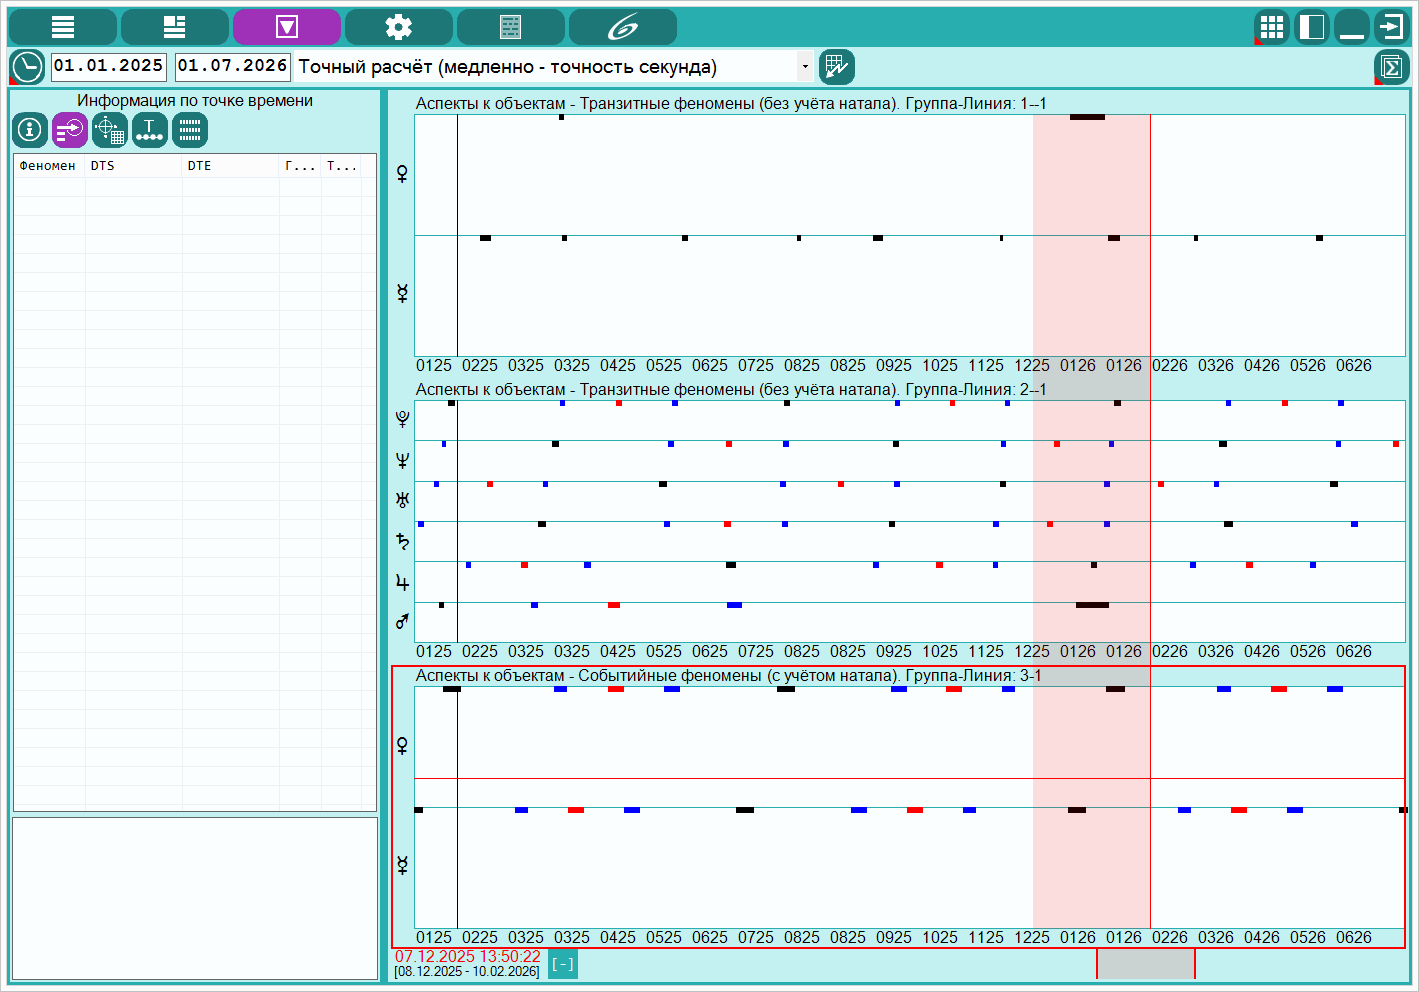
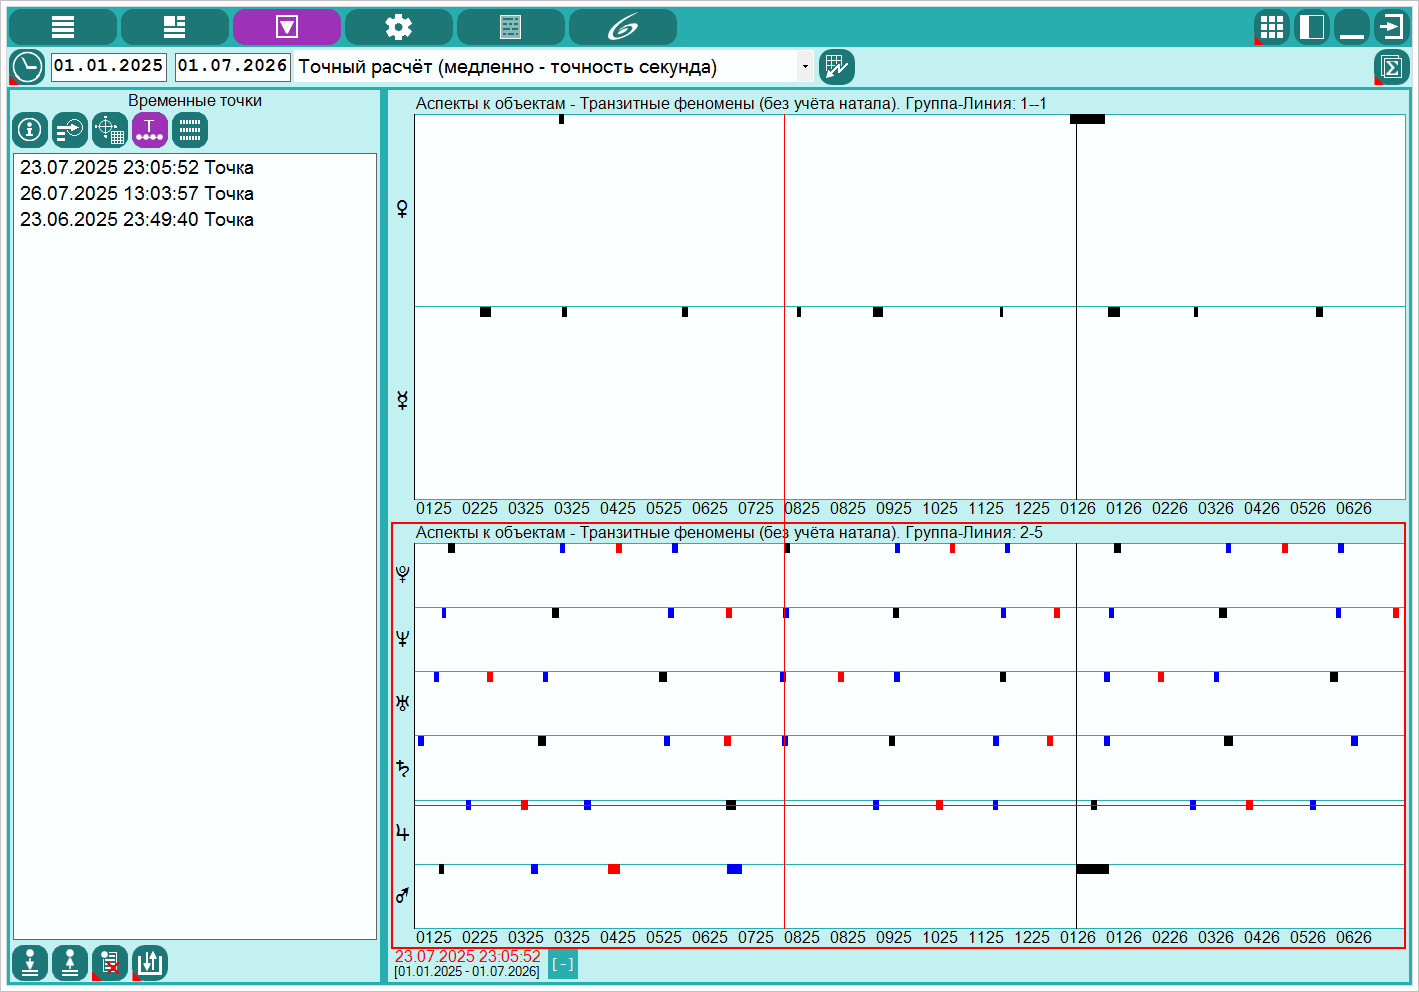
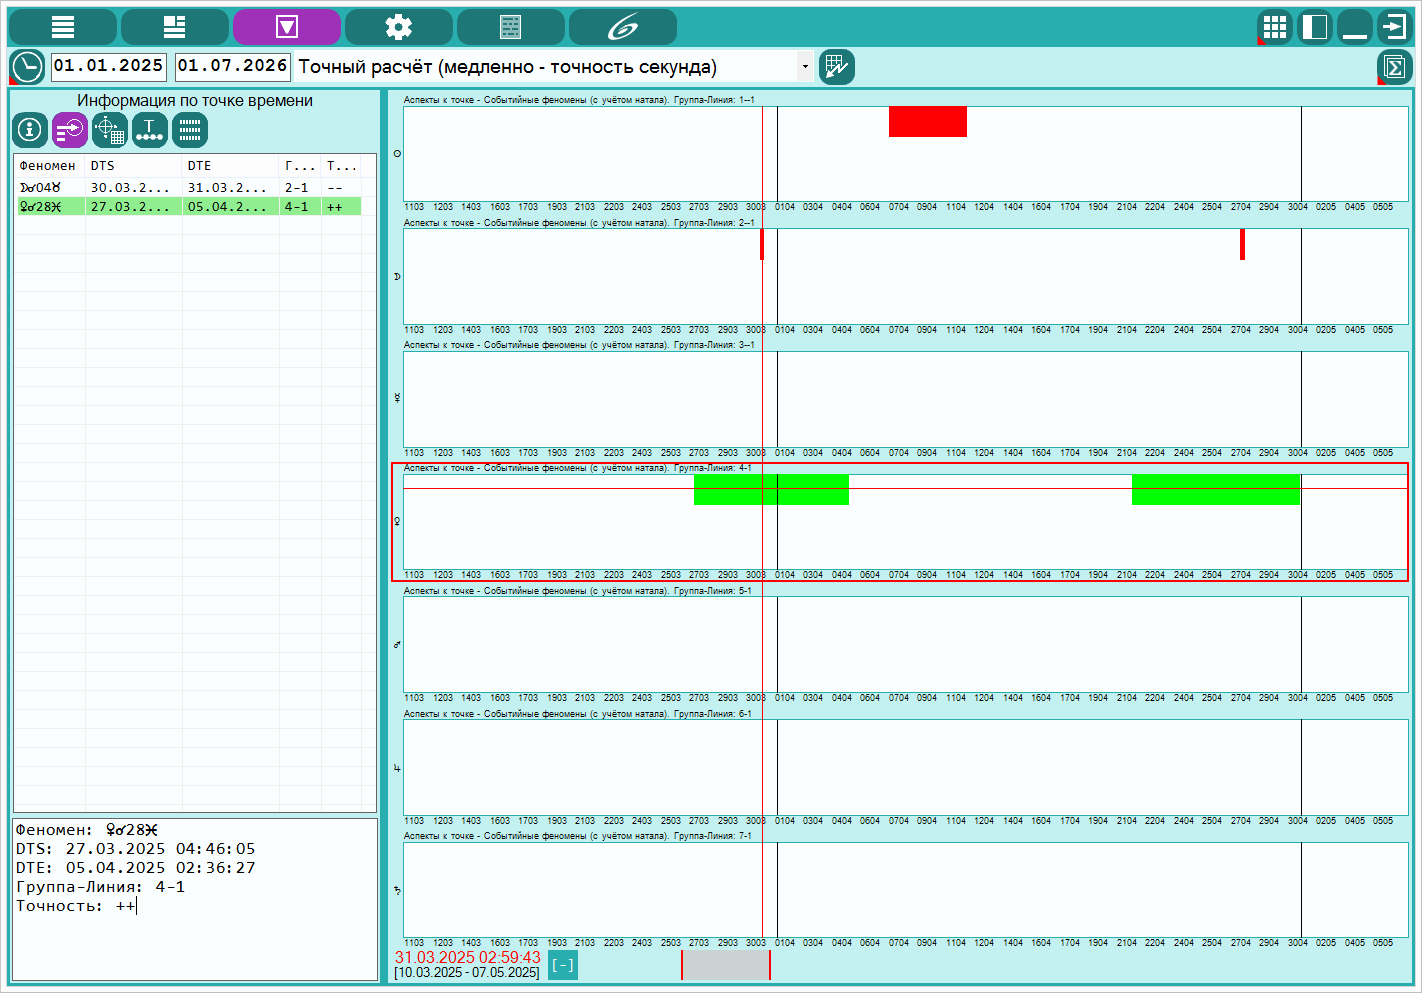
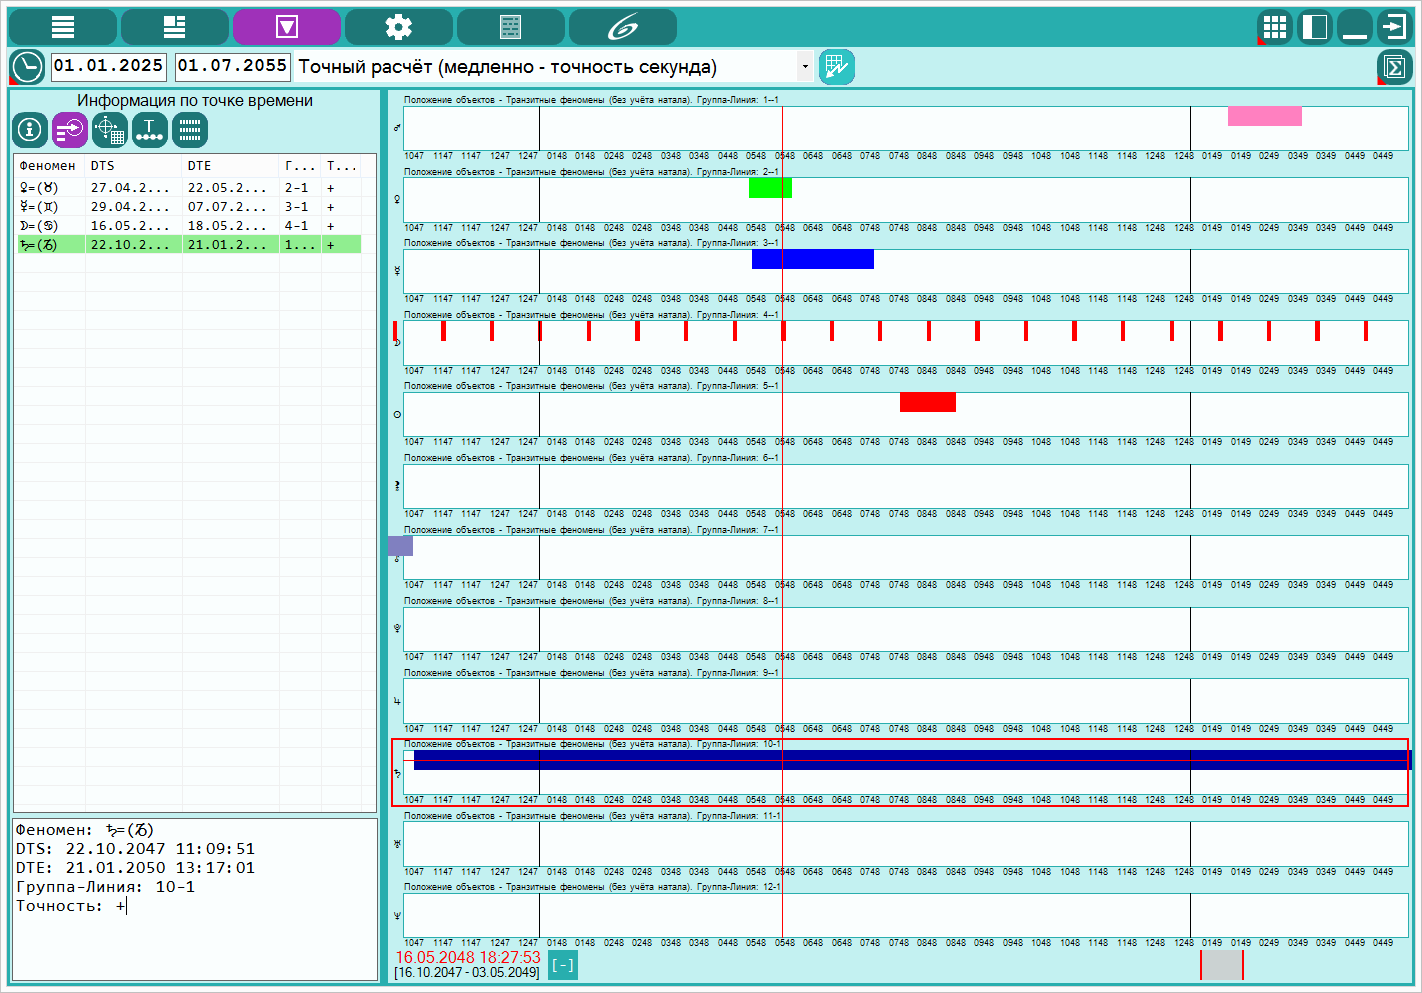
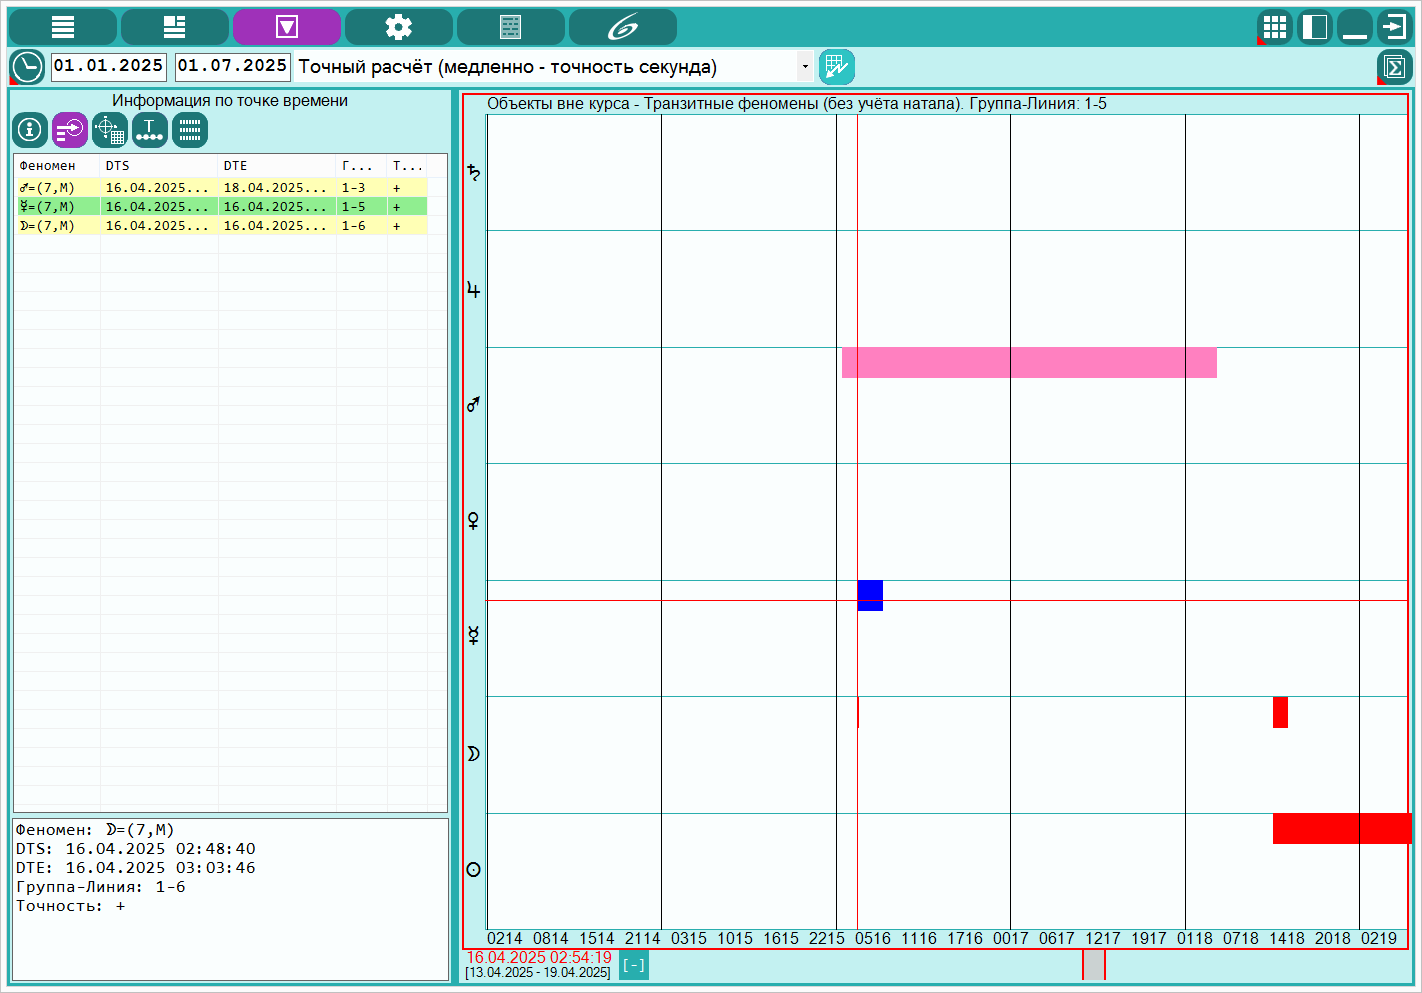
Data analysis. Search mode - aspects for objects. Information on the point of time. Depending on the search mode, from this screen you can see accurate representations of the date-time of the search results of a phenomenon selected on the screen in the group and the line with the left mouse button. Those when clicking the left mouse button on the screen, the cursor will be displayed in the form of a vertical and horizontal line. And if the result of the search (phenomenon) is displayed at the place of intersection of the cursor lines, then the exact periods of the specified phenomenon will be displayed in the list to the left of the groups. Since the vertical line (cursor of the date-time) - crosses all groups and lines, then all phenomena will be displayed on the list on the indicated date and time. But depending on whether they are included in the same group and whether the horizontal line falls on the phenomenon, the recordings in the list will be displayed by different colors:
|
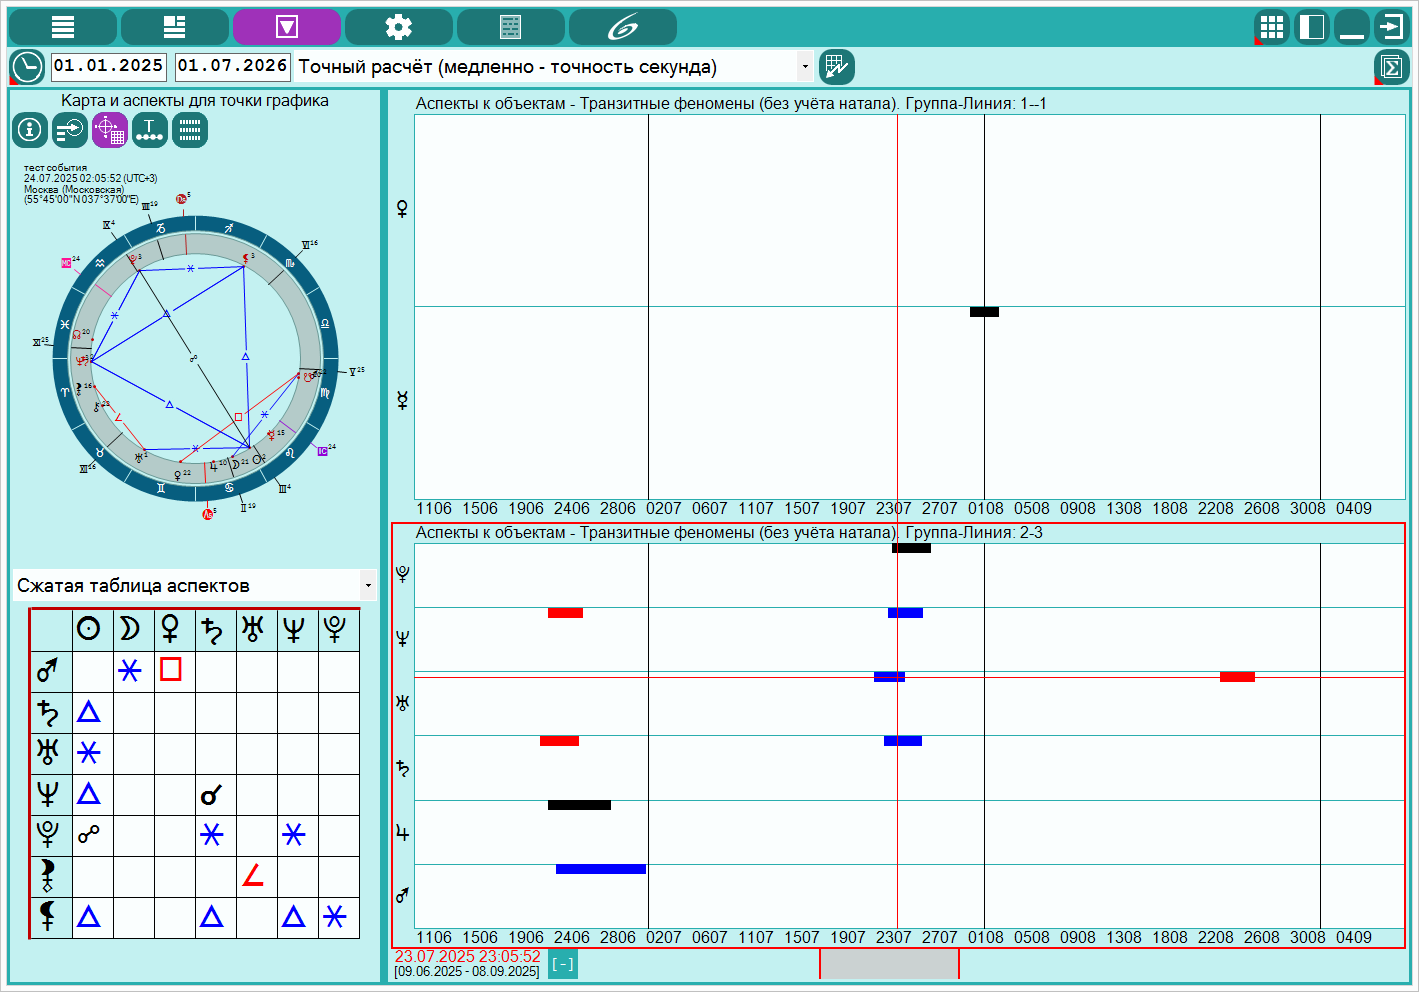 |
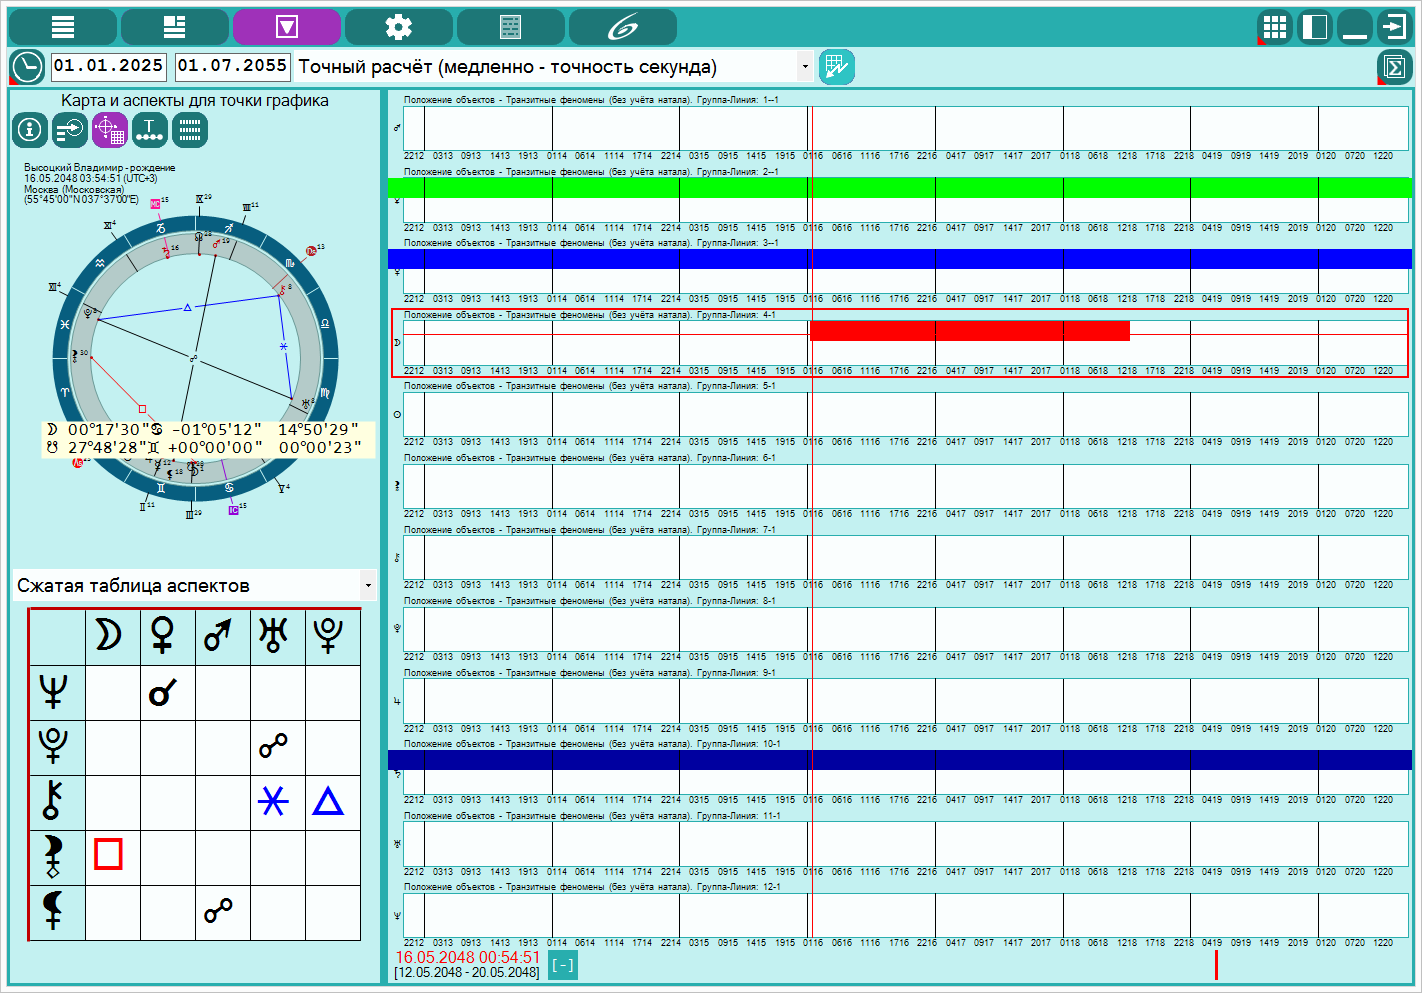
Data analysis. The mode of operation is transit phenomena. Chart and aspects for the schedule. On this screen you can see the chart and its aspects for the date of the date-time under the cursor. Those by clicking with the left button on the screen with the search results, we set the date point time under the cursor and for this temporary point we see a single transit chart with aspects inside the chart. |
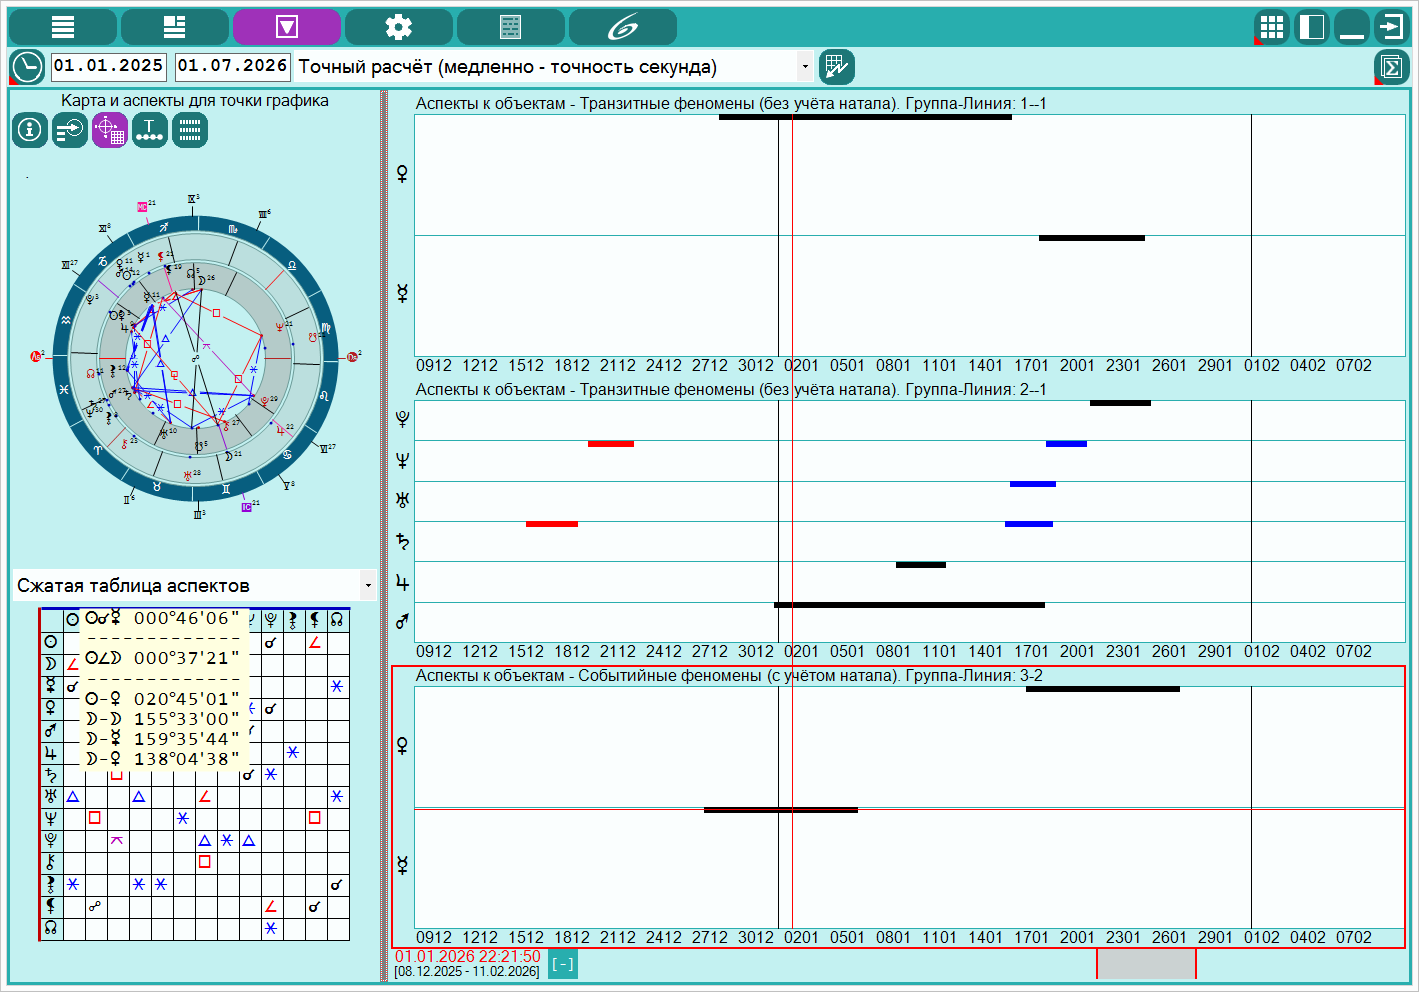 |
Data analysis. The mode of operation is event phenomena. Chart and aspects for the schedule. On this screen you can see the chart and its aspects for the date of the date-time under the cursor. Those by clicking with the left button on the screen with the search results, we set the date point time under the cursor and for this temporary point we see a double chart with a cross-institute from the event chart and the selected astrological inspection to the natal chart. |
 |
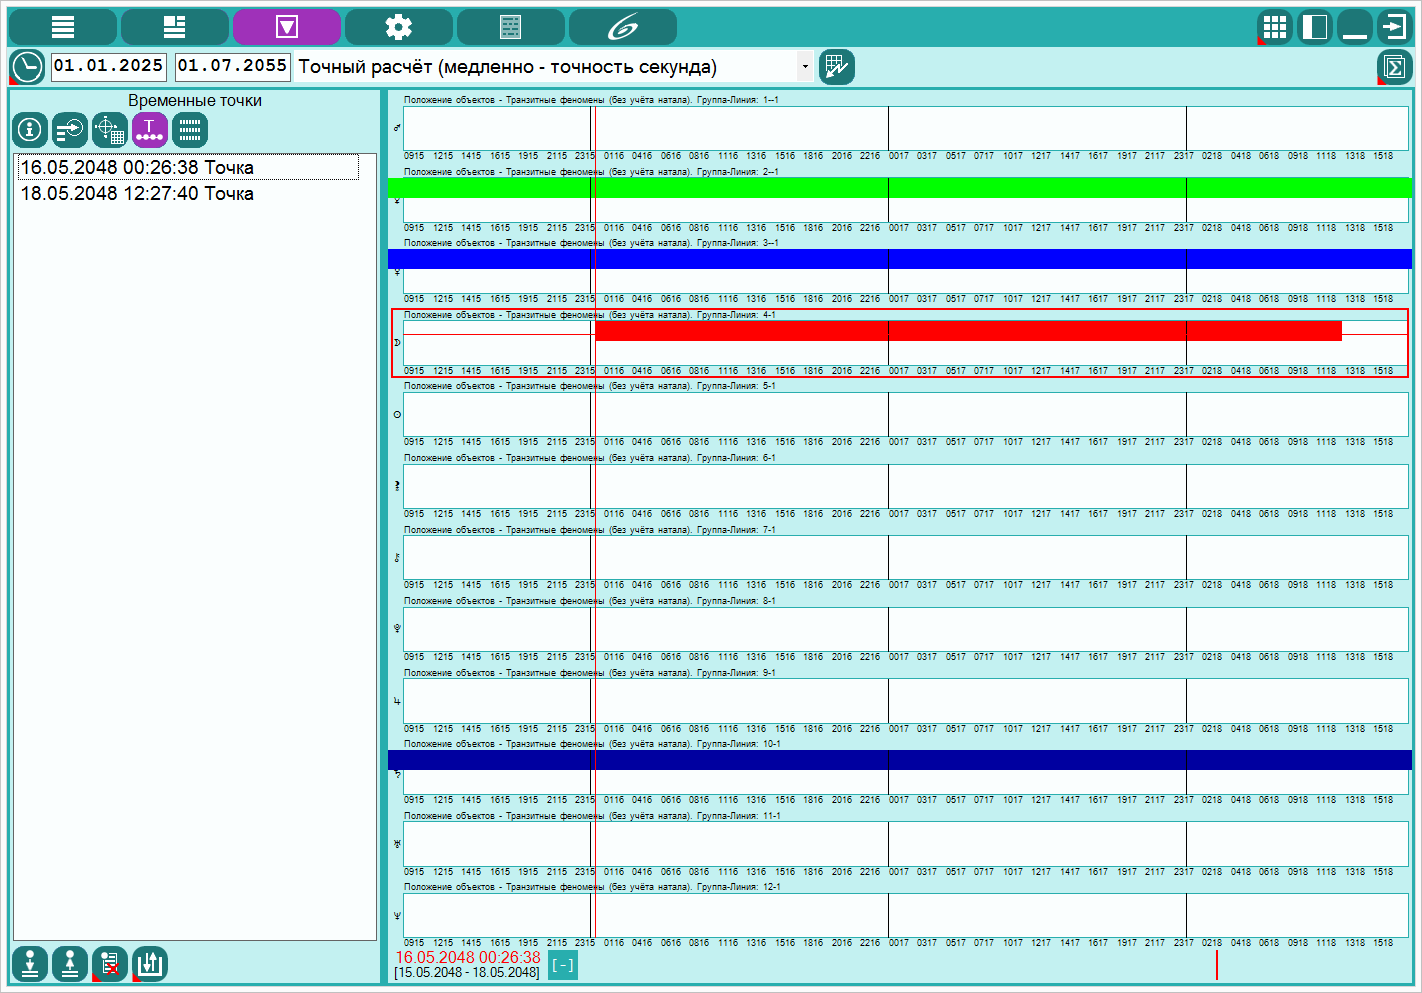
Data analysis. Search mode - aspects for objects. Temporary points. From this screen you can create, restore, save, load and display the temporary points created by the user during operation. The mechanism of time points allows you to quickly return to the desired date-time, which were preserved during operation. In addition, saved temporary points can be transferred to another program for the subsequent analysis of phenomena. |
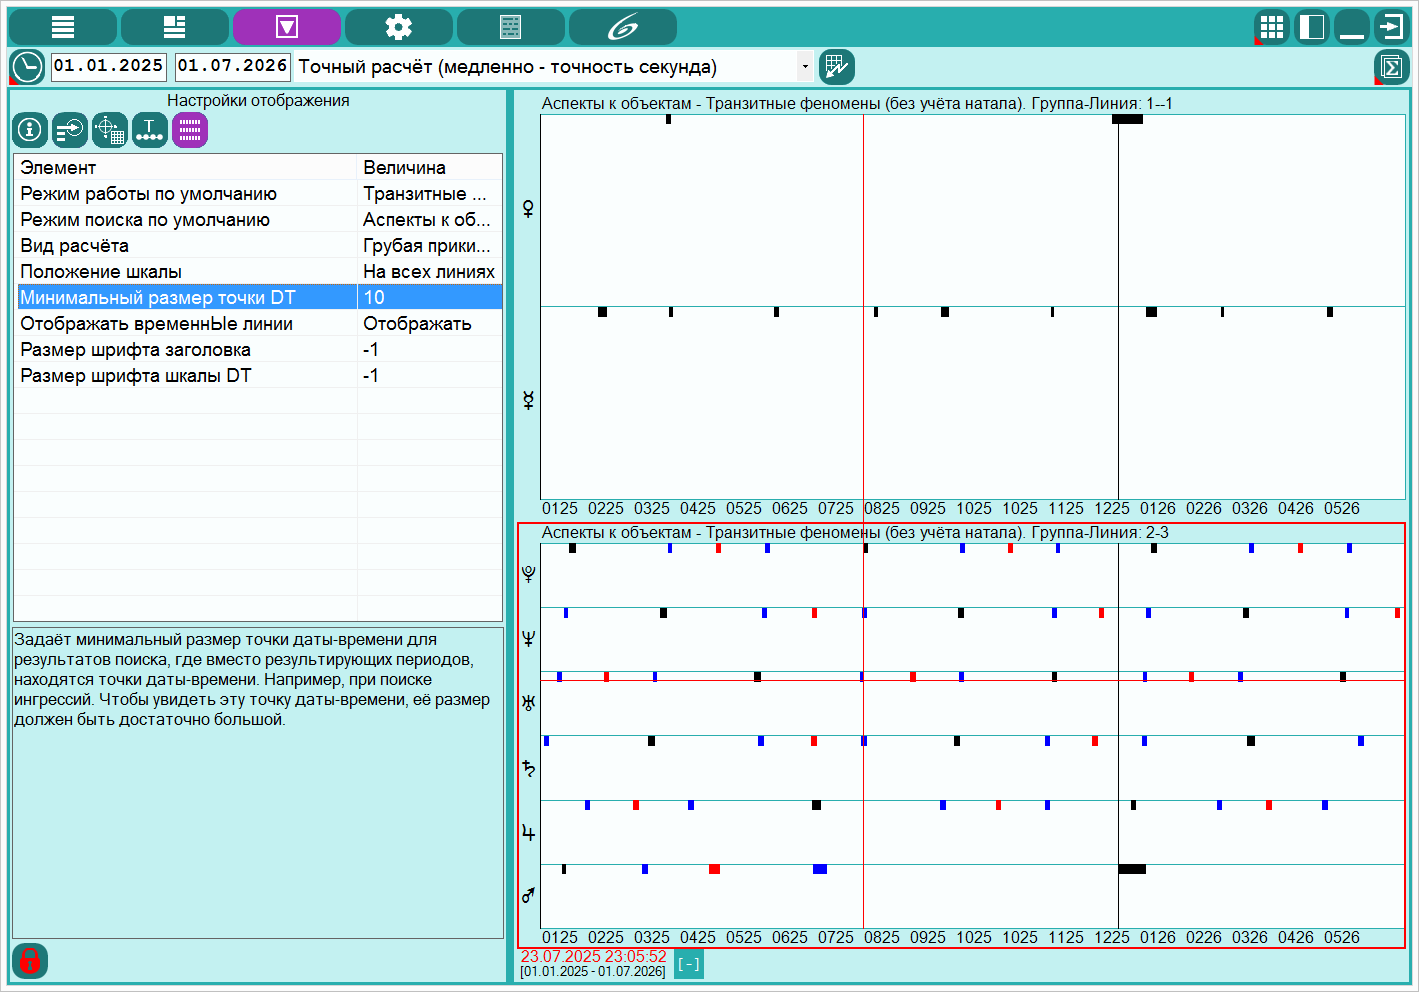 |
Data analysis. Search mode - aspects for objects. Display settings. On this screen, settings are set (preserved) inherent only in this program for permanent storage and use. For example, one of the phenomena may be the ingresses of Objects to the signs of the zodiac. And since ingression is not a period, but one moment, then on the graph such phenomens cannot be displayed in the form of lines, but are displayed in the form of circles of a given radius so that these moments can be seen on the graph. To change the settings, you must perform actions:
|
Datata analysis. Search mode - aspects to the point
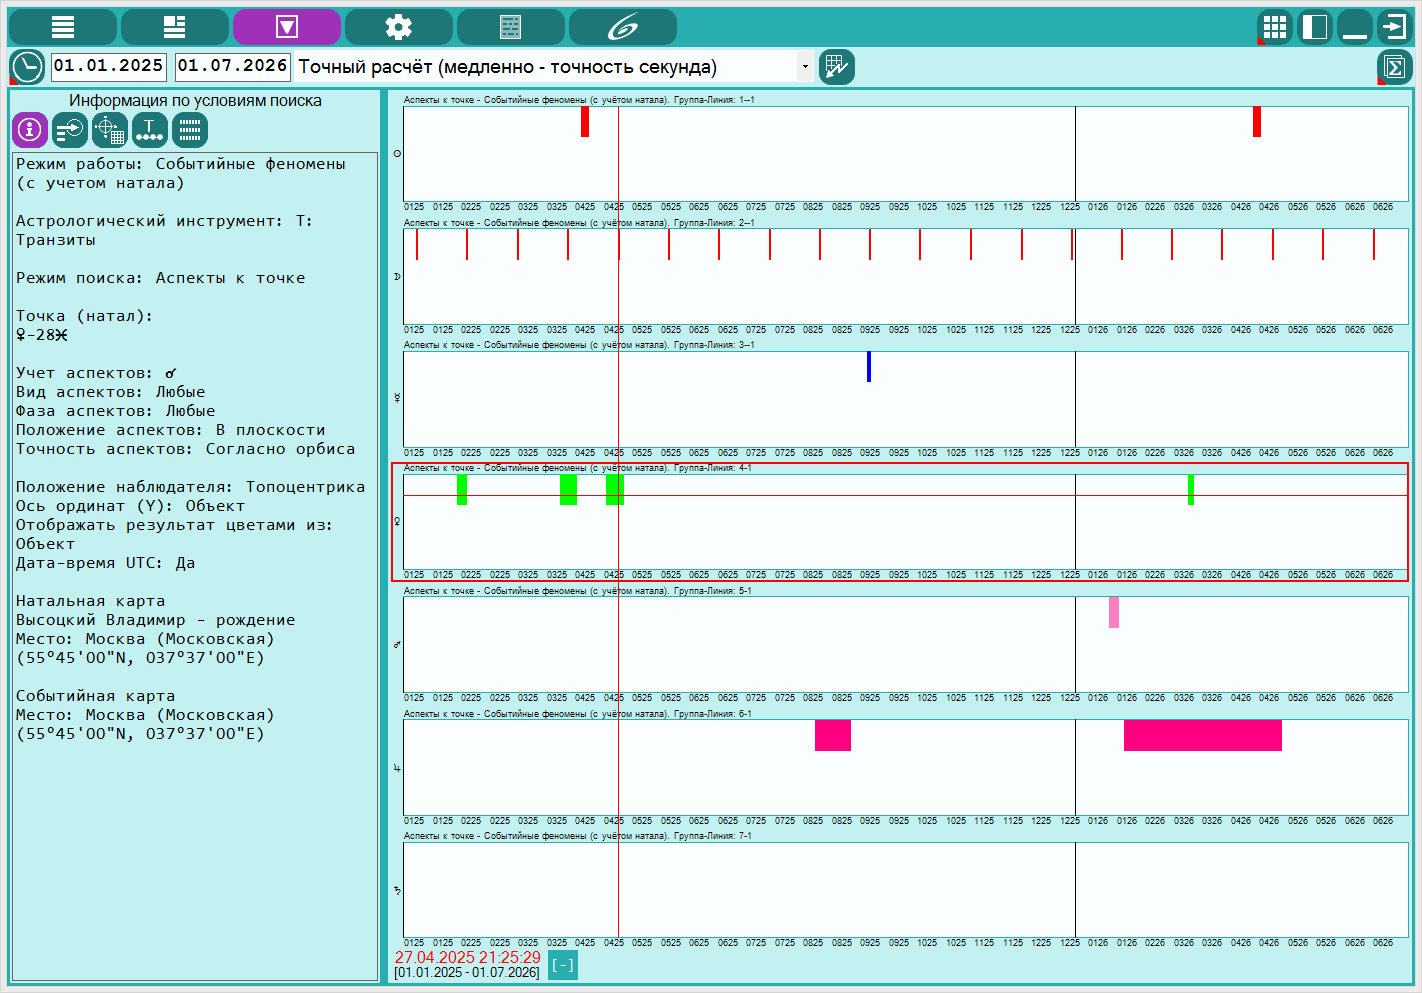 |
Data analysis. Search mode - aspects to the point. Information on the search conditions. The result of the search is aspects from objects to points. Depending on the operating mode, the aspects are searched between objects and specified points:
|
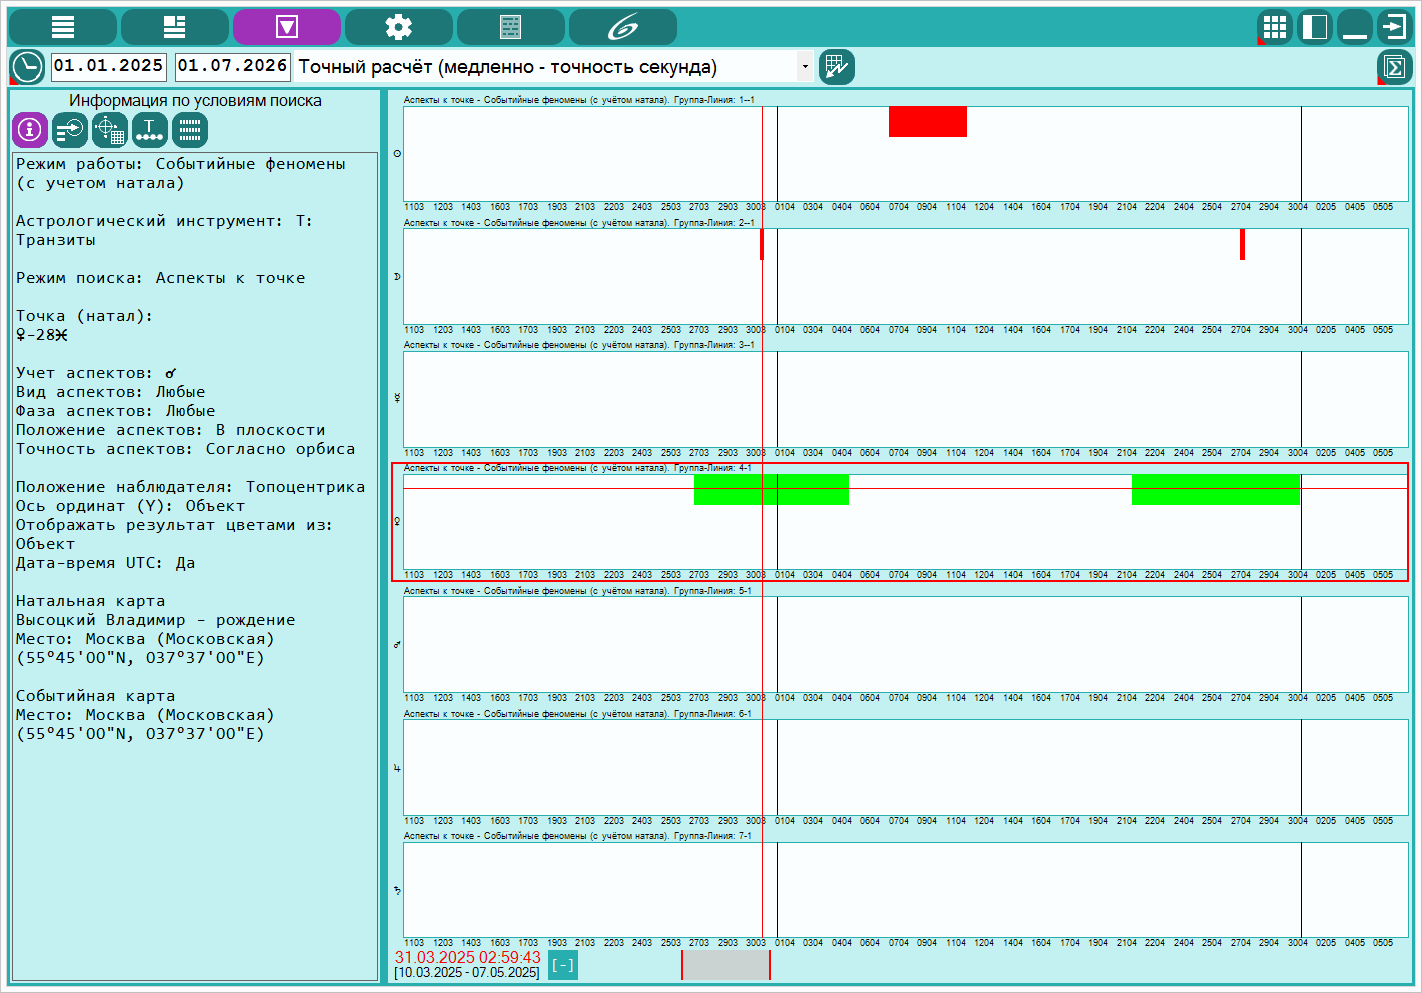 |
Data analysis. Search mode - aspects to the point. Scaling the search period of aspects. After obtaining the results of the search for phenomena in a given period, you can scale the rear periods and thereby increase the scale of display of the results. Those. displaying the reduced period (part of the period under consideration), You can increase the display of the result of the result on the graph. Thus, by increasing the scale of display, you can more accurately set the cursor on the resulting graphics. The scaling of the period is drawn with the clamping of the right mouse button and dragging the mouse cursor to the right to increase the mashstab of the display. While dragging the highlighted scalable period is painted with a shade of red. And after the scaling, the increased subordiod is displayed at the bottom of the screen with a shade of red, showing which part of the scalable period is displayed on the screen. A return to the initial period under consideration is made when you press the button, displayed water in groups at the bottom of the screen, next to the time period and a temporary point. |
 |
Data analysis. Search mode - aspects to the point. Information on the point of time. Depending on the search mode, from this screen you can see accurate representations of the date-time of the search results of a phenomenon selected on the screen in the group and the line with the left mouse button. Those when clicking the left mouse button on the screen, the cursor will be displayed in the form of a vertical and horizontal line. And if the result of the search (phenomenon) is displayed at the place of intersection of the cursor lines, then the exact periods of the specified phenomenon will be displayed in the list to the left of the groups. Since the vertical line (cursor of the date-time) - crosses all groups and lines, then all phenomena will be displayed on the list on the indicated date and time. But depending on whether they are included in the same group and whether the horizontal line falls on the phenomenon, the recordings in the list will be displayed by different colors:
|
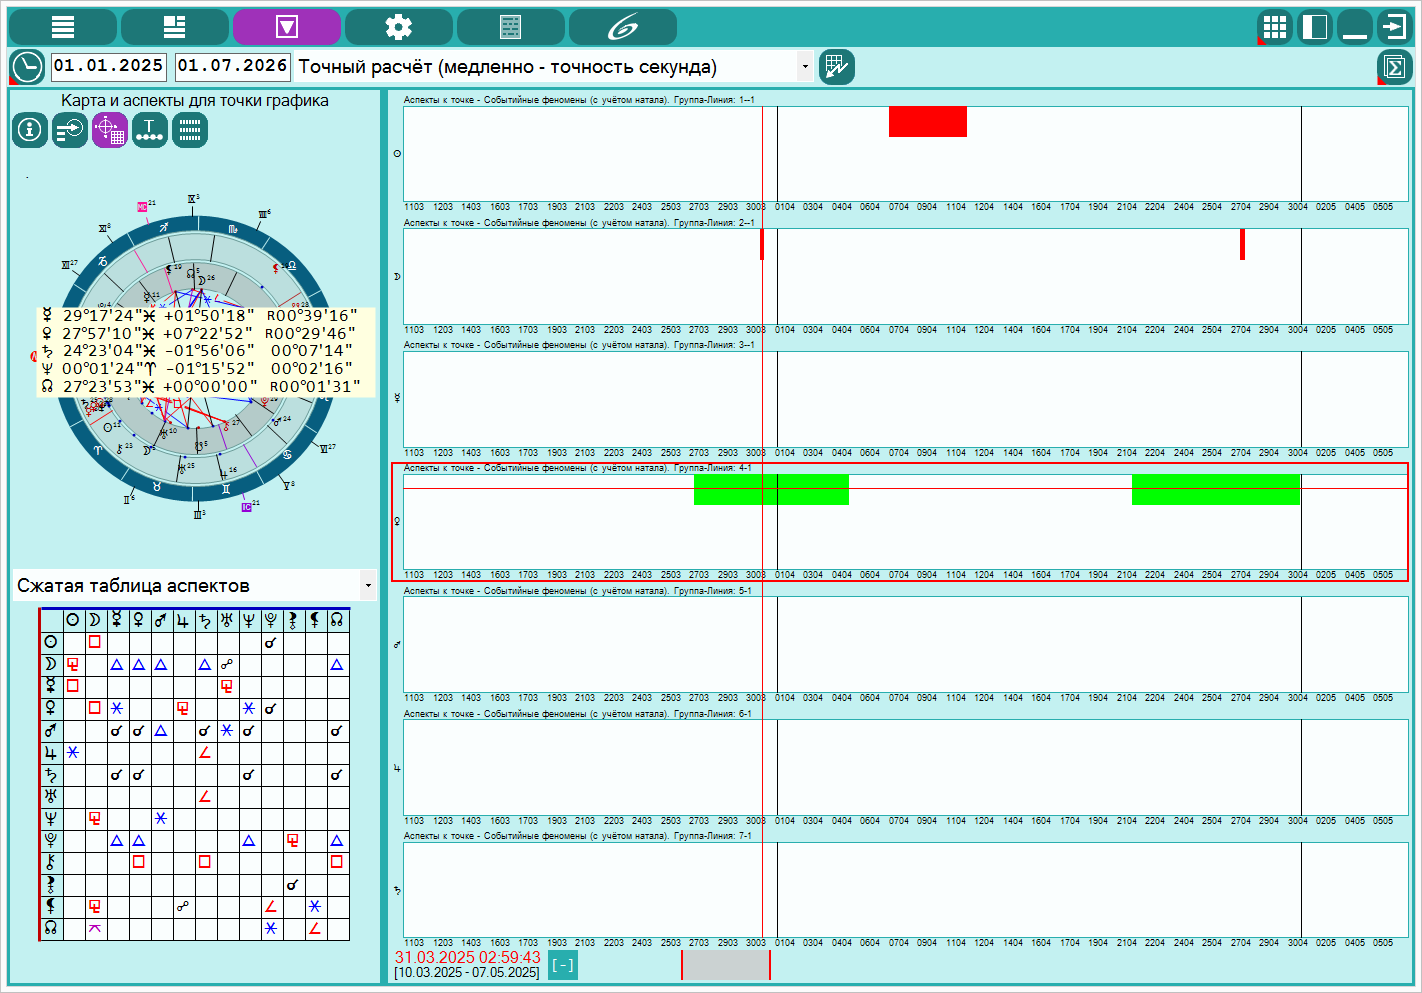 |
Data analysis. Search mode - aspects to the point. Chart and aspects for the schedule. On this screen you can see the chart and its aspects for the date of the date-time under the cursor. Those. By clicking the left mouse button on the screen with the search results, we set the date of the date-time under the cursor and we see the chart for this temporary point. Depending on the mode of operation, it may be displayed:
|
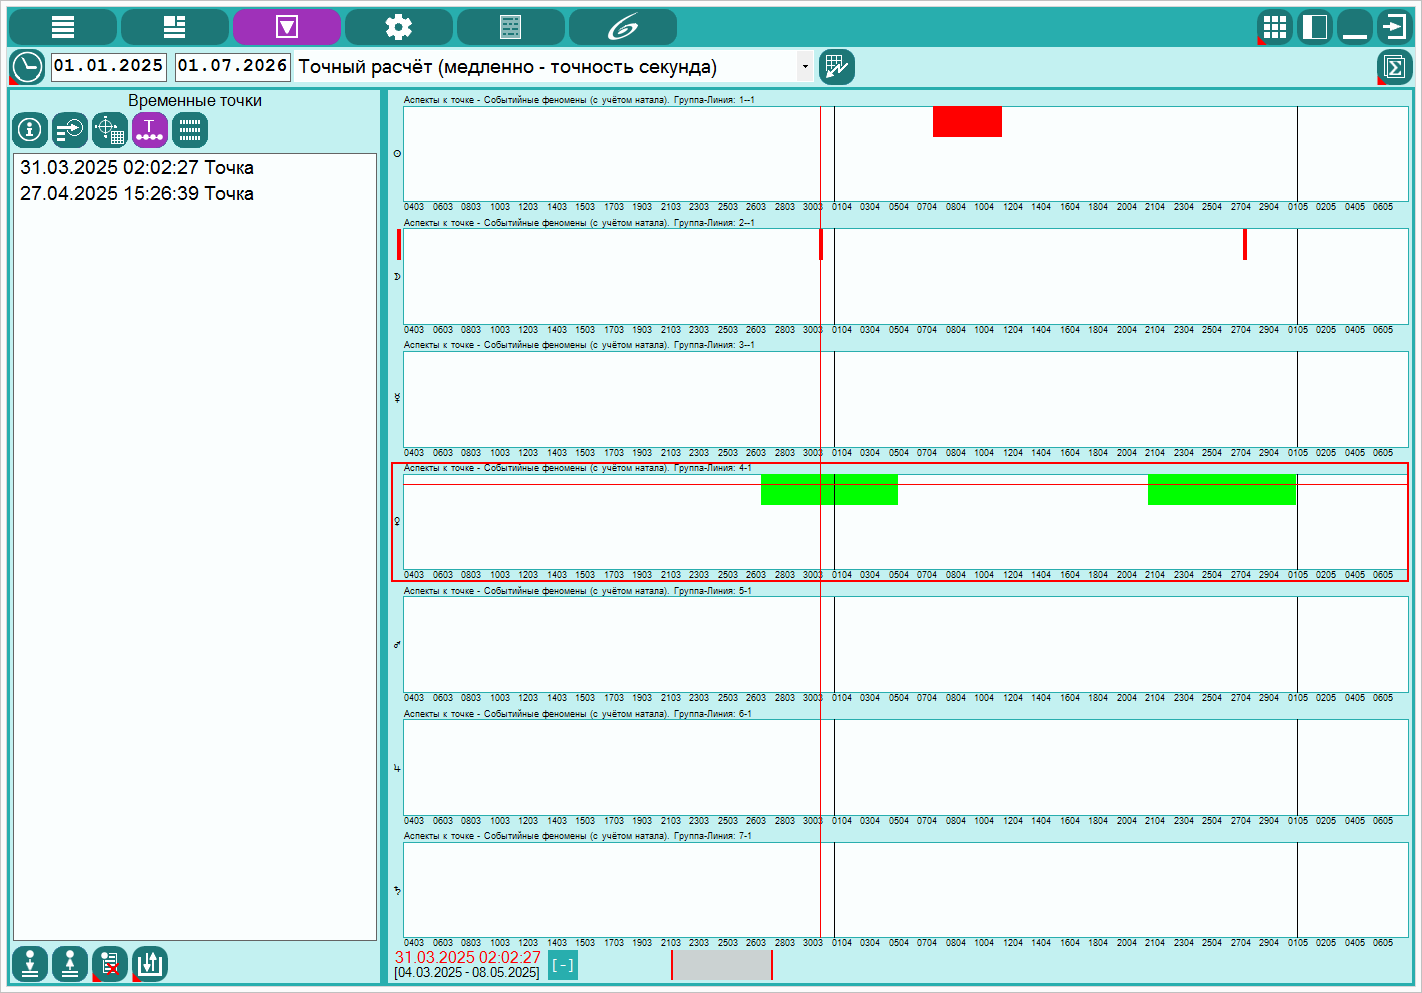 |
Data analysis. Search mode - aspects to the point. Temporary points. From this screen you can create, restore, save, load and display the temporary points created by the user during operation. The mechanism of time points allows you to quickly return to the desired date-time, which were preserved during operation. In addition, saved temporary points can be transferred to another program for the subsequent analysis of phenomena. |
Data analysis. Search mode - ingression of objects
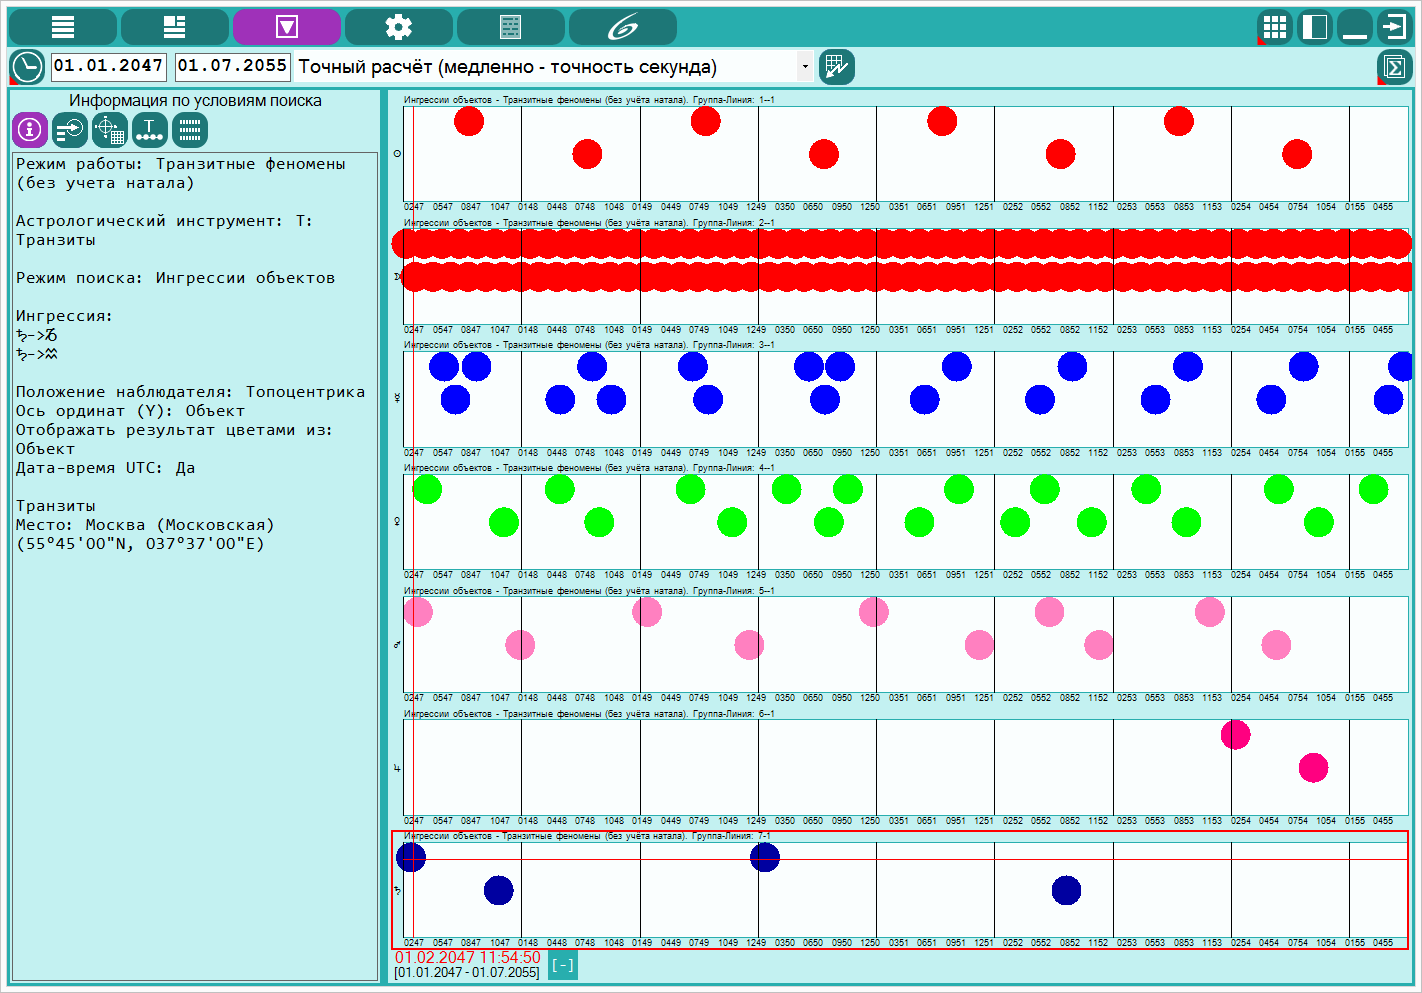 |
Data analysis. Search mode - objects of objects. Information on the search conditions. The search for the ingresses of objects in:
|
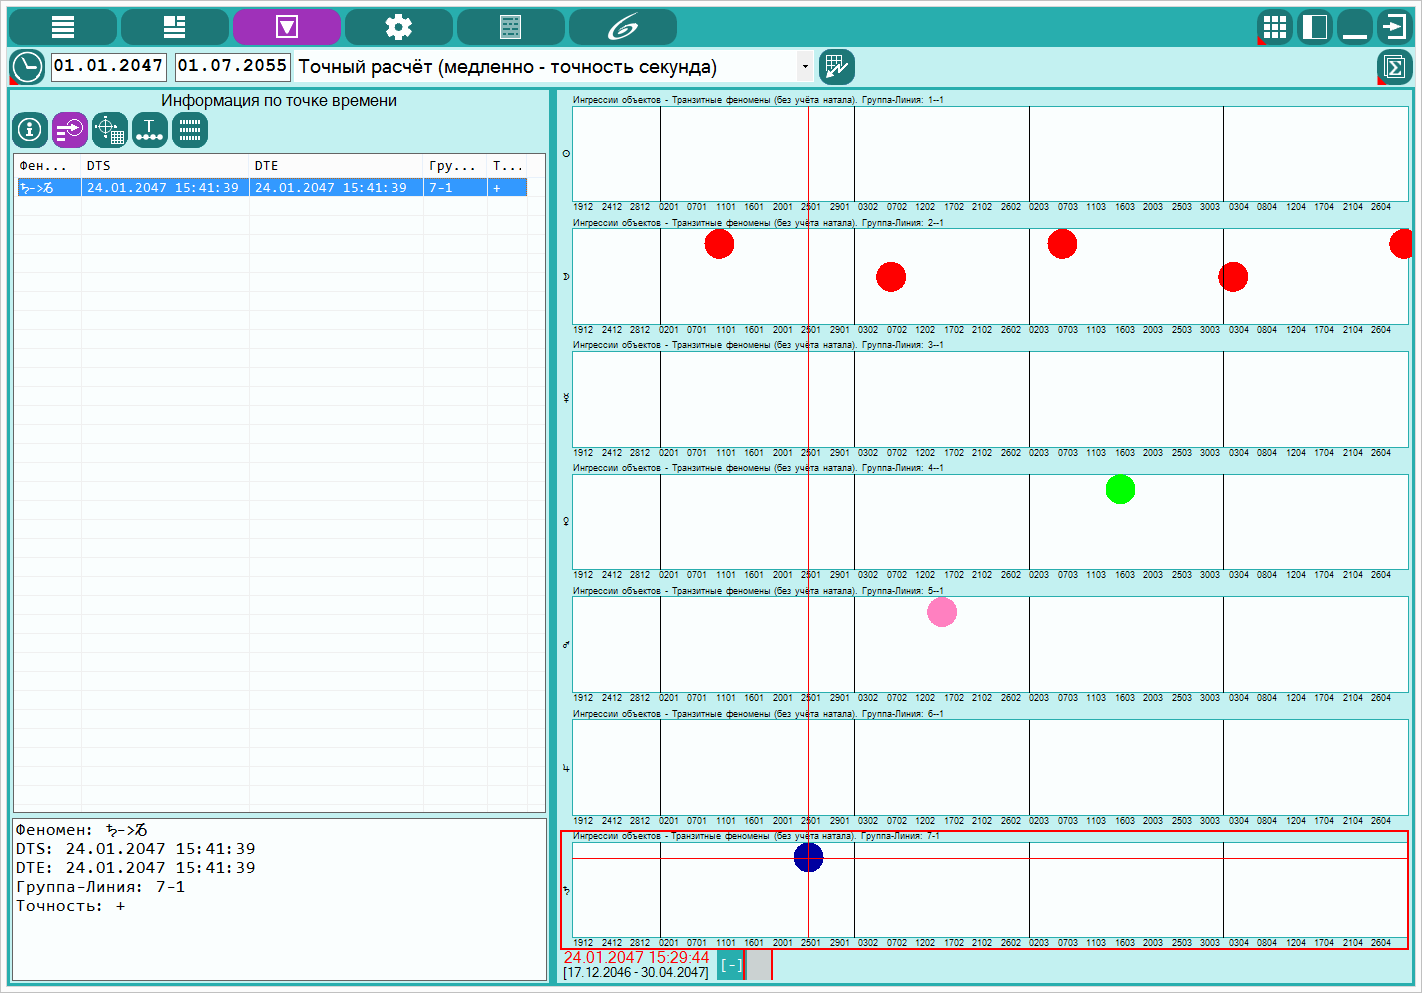 |
Data analysis. Search mode - objects of objects. Information on the point of time. Depending on the search mode, from this screen you can see accurate representations of the date-time of the search results of a phenomenon selected on the screen in the group and the line with the left mouse button. Those when clicking the left mouse button on the screen, the cursor will be displayed in the form of a vertical and horizontal line. And if the result of the search (phenomenon) is displayed at the place of intersection of the cursor lines, then the exact periods of the specified phenomenon will be displayed in the list to the left of the groups. Since the vertical line (cursor of the date-time) - crosses all groups and lines, then all phenomena will be displayed on the list on the indicated date and time. But depending on whether they are included in the same group and whether the horizontal line falls on the phenomenon, the recordings in the list will be displayed by different colors:
|
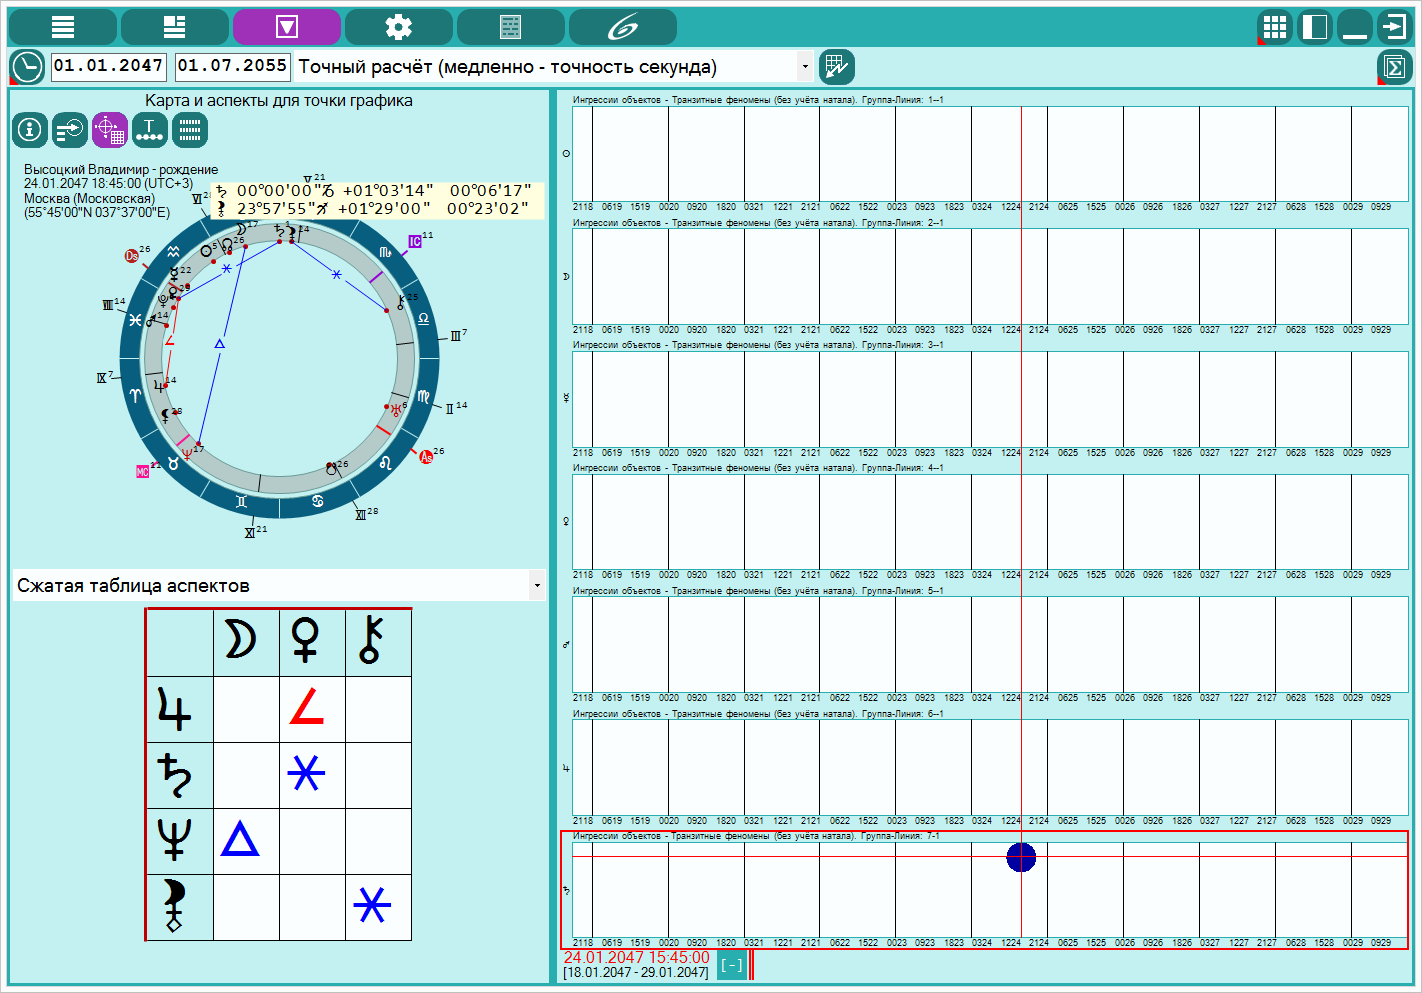 |
Data analysis. Search mode - objects of objects. Chart and aspects for the schedule. On this screen you can see the chart and its aspects for the date of the date-time under the cursor. Those. By clicking the left mouse button on the screen with the search results, we set the date of the date-time under the cursor and we see the map for this temporary point. Depending on the mode of operation, it may be displayed:
|
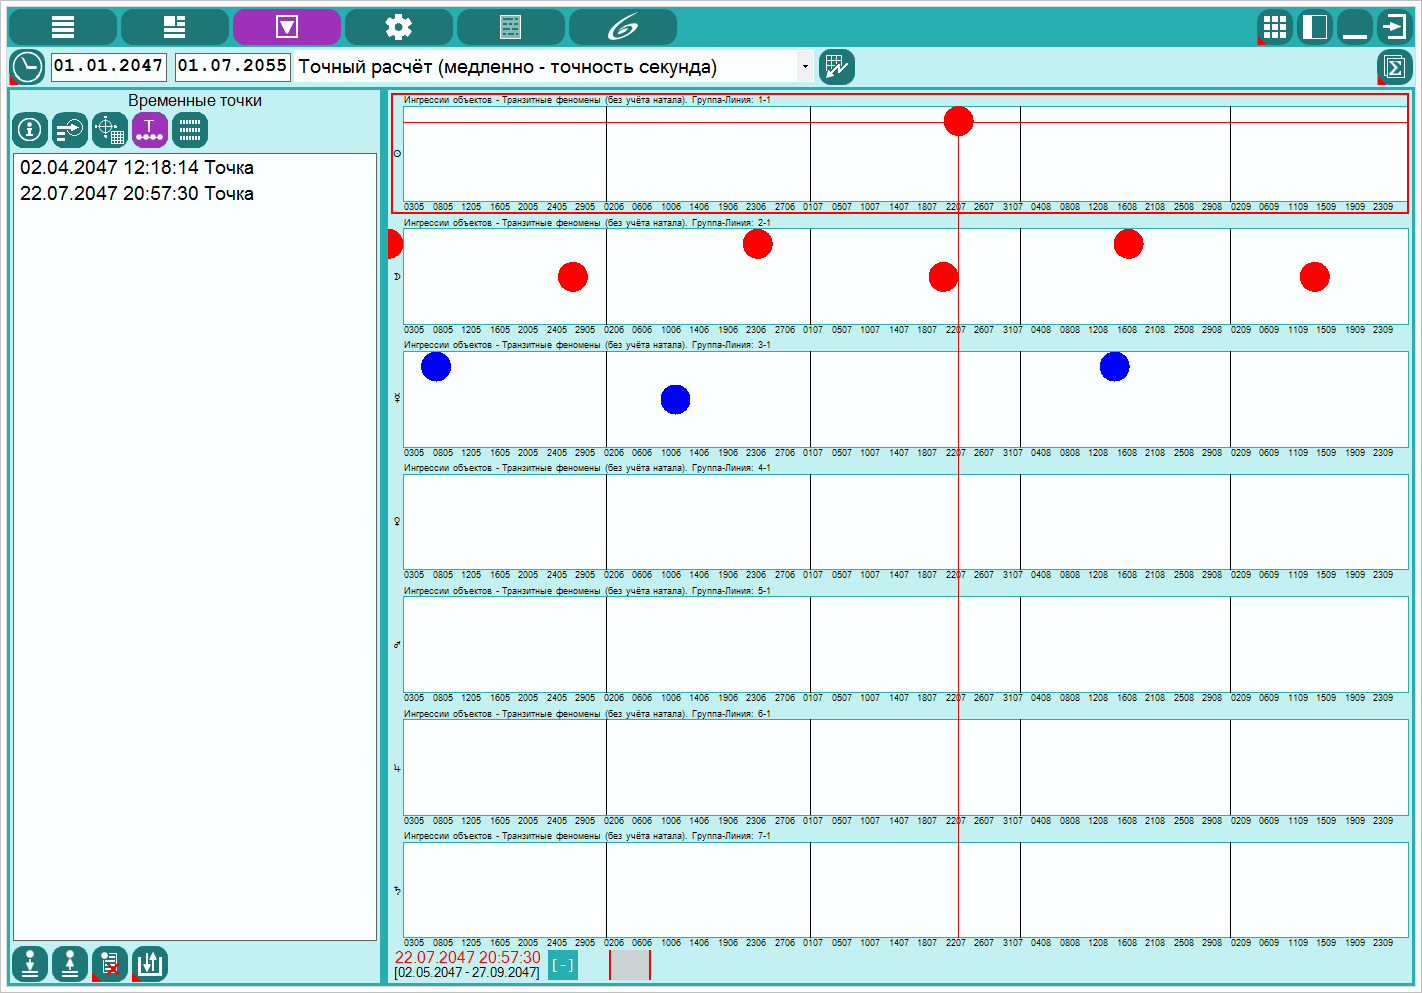 |
Data analysis. Search mode - objects of objects. Temporary points. From this screen you can create, restore, save, load and display the temporary points created by the user during operation. The mechanism of time points allows you to quickly return to the desired date-time, which were preserved during operation. In addition, saved temporary points can be transferred to another program for the subsequent analysis of phenomena. |
Data analysis. Search mode - position of objects
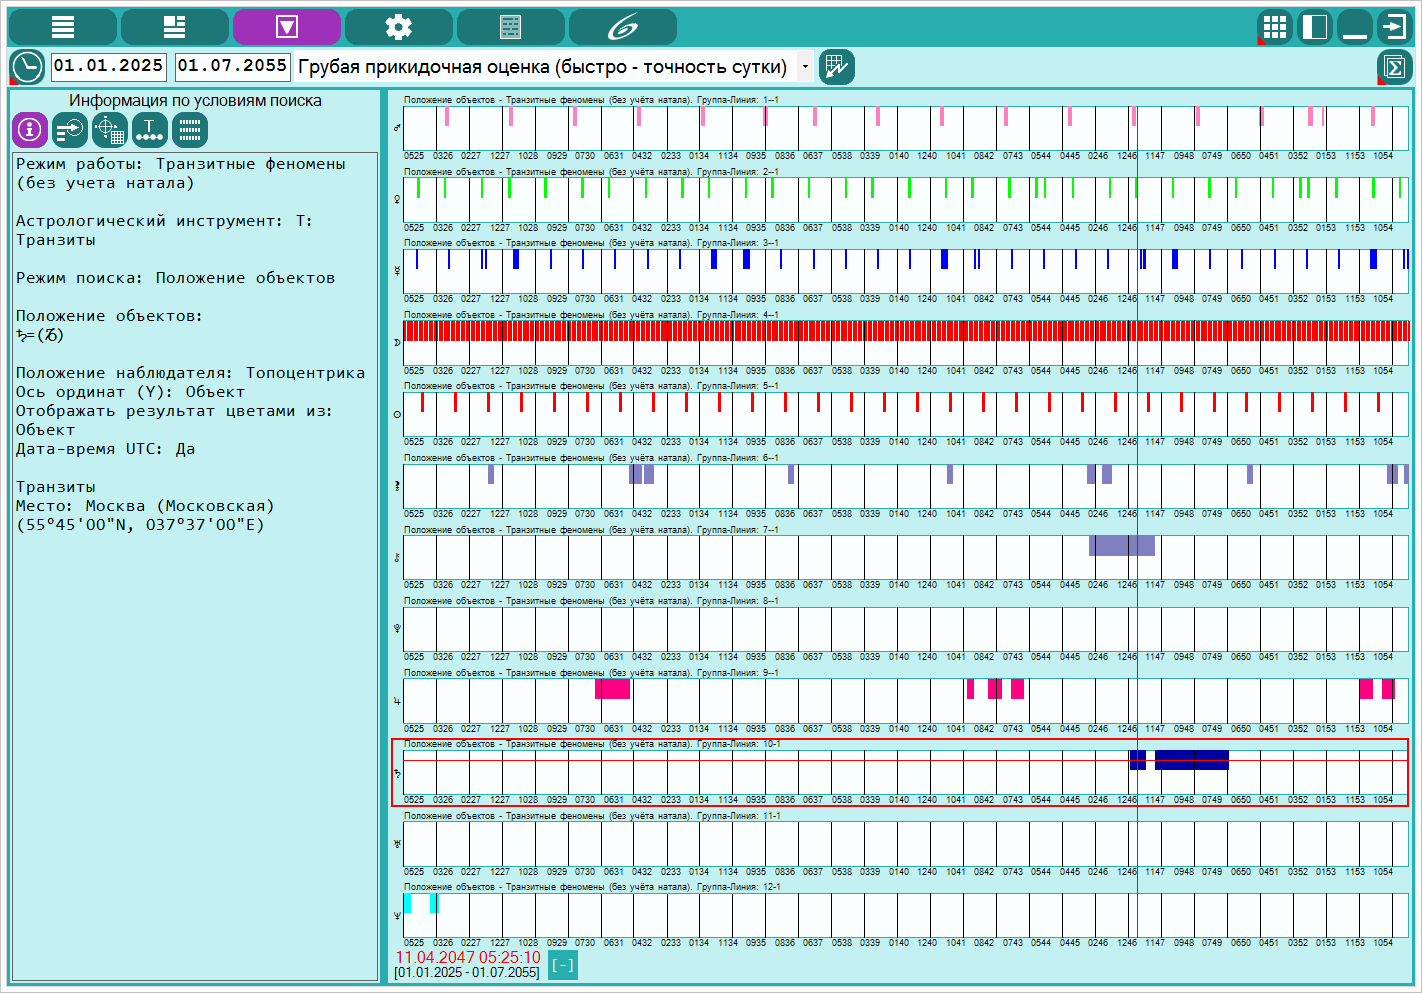 |
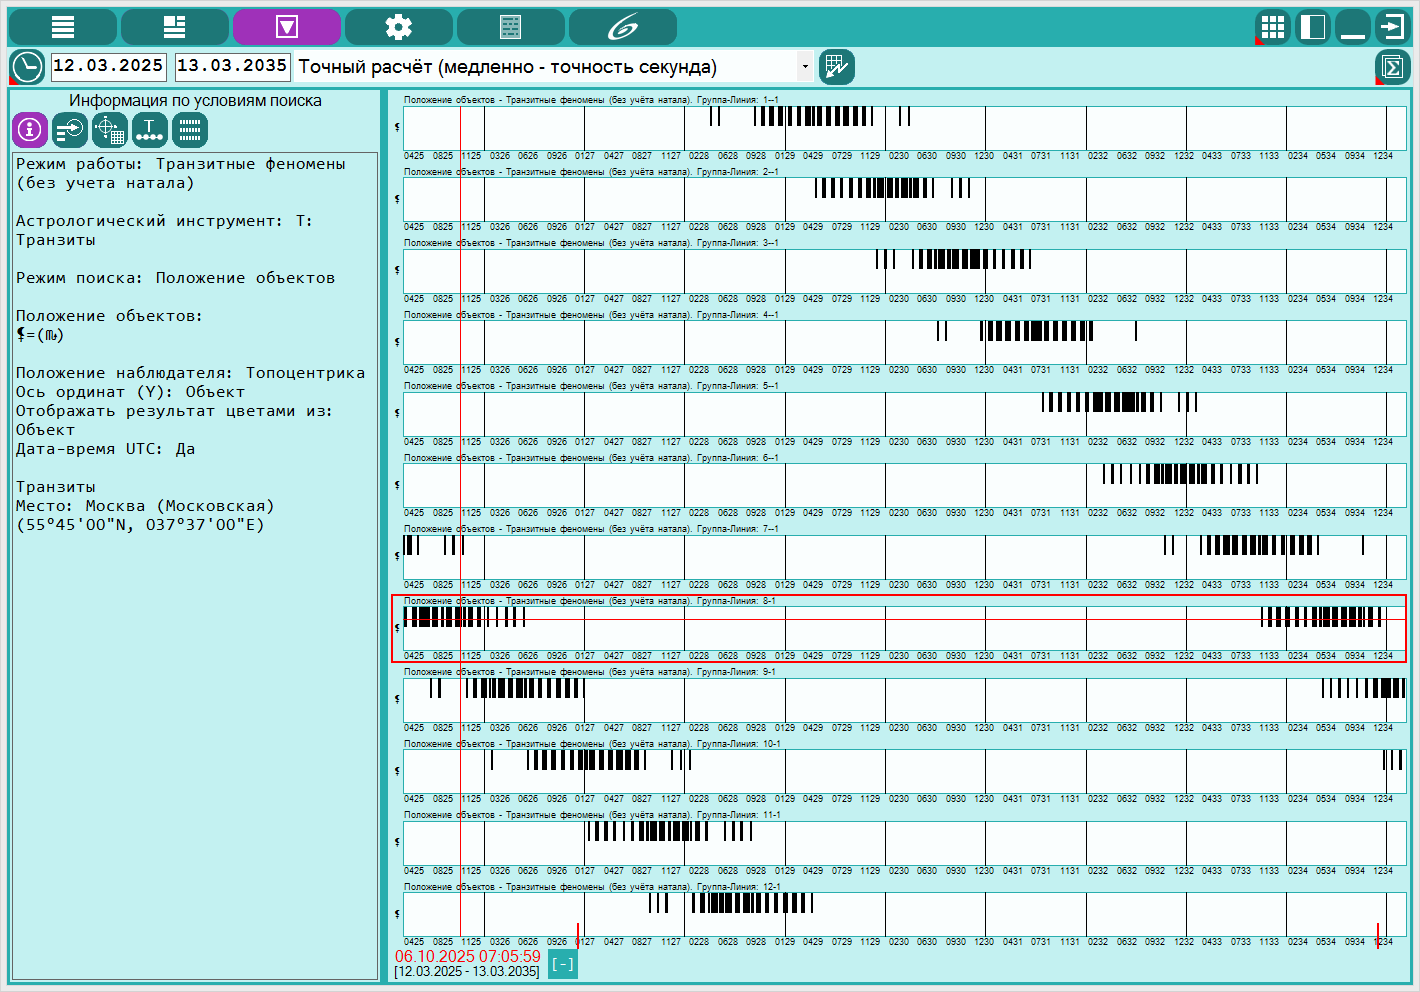
Data analysis. Search mode is the position of objects. Information on the search conditions. Search for periods of finding objects in the zones:
|
 |
Data analysis. Search mode is the position of objects. Information on the point of time. Depending on the search mode, from this screen you can see accurate representations of the date-time of the search results of a phenomenon selected on the screen in the group and the line with the left mouse button. Those when clicking the left mouse button on the screen, the cursor will be displayed in the form of a vertical and horizontal line. And if the result of the search (phenomenon) is displayed at the place of intersection of the cursor lines, then the exact periods of the specified phenomenon will be displayed in the list to the left of the groups. Since the vertical line (cursor of the date-time) - crosses all groups and lines, then all phenomena will be displayed on the list on the indicated date and time. But depending on whether they are included in the same group and whether the horizontal line falls on the phenomenon, the recordings in the list will be displayed by different colors:
|
 |
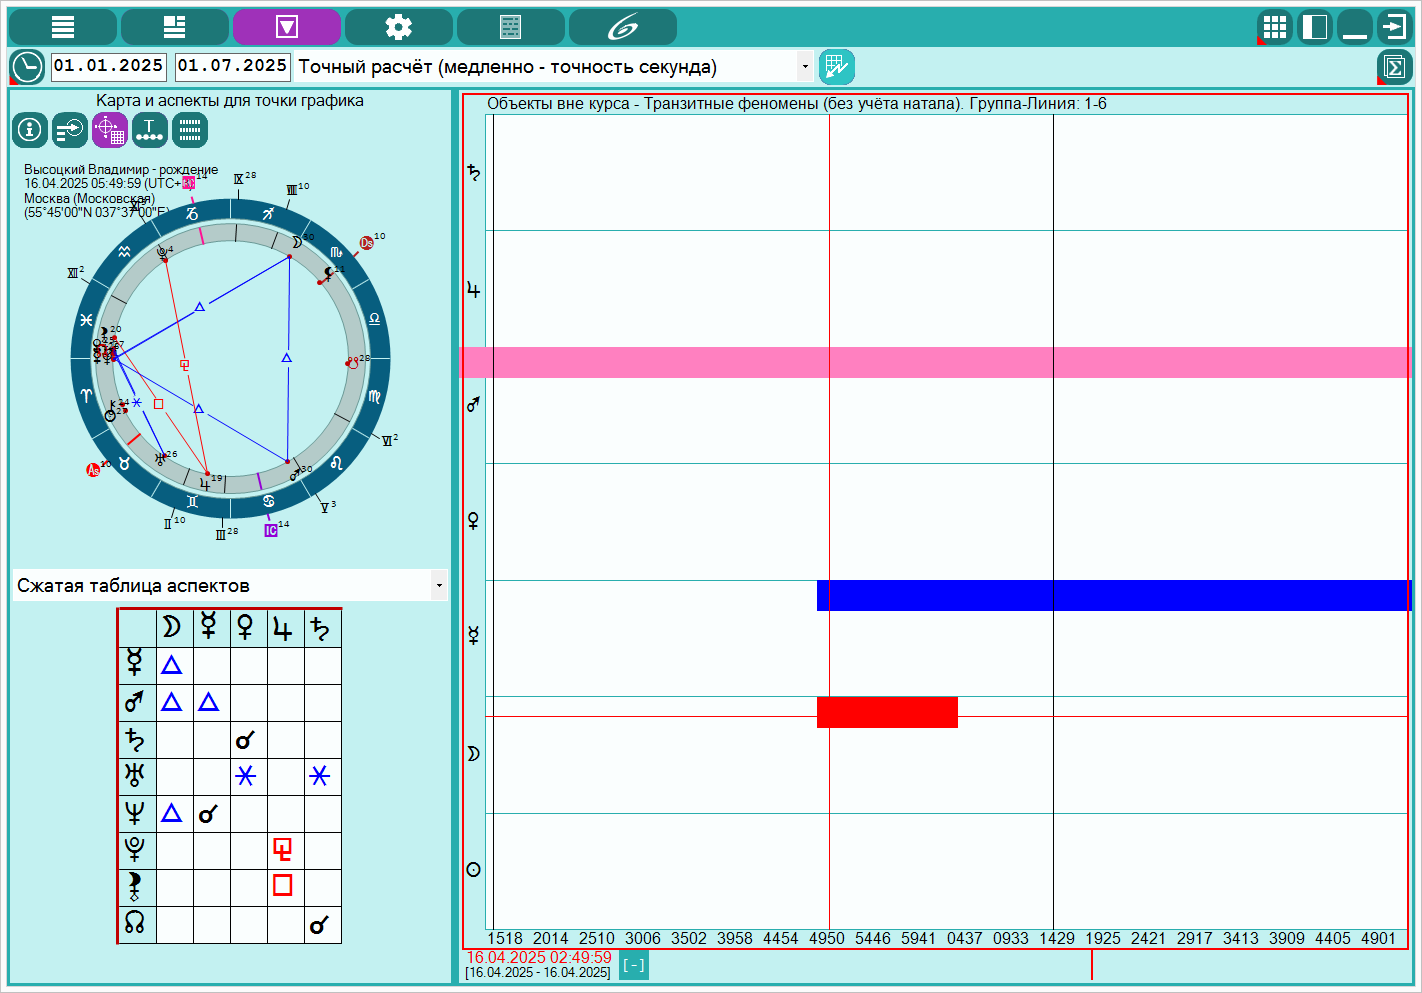
Data analysis. Search mode is the position of objects. Chart and aspects for the schedule. On this screen you can see the chart and its aspects for the date of the date-time under the cursor. Those. By clicking the left mouse button on the screen with the search results, we set the date of the date-time under the cursor and we see the map for this temporary point. Depending on the mode of operation, it may be displayed:
|
 |
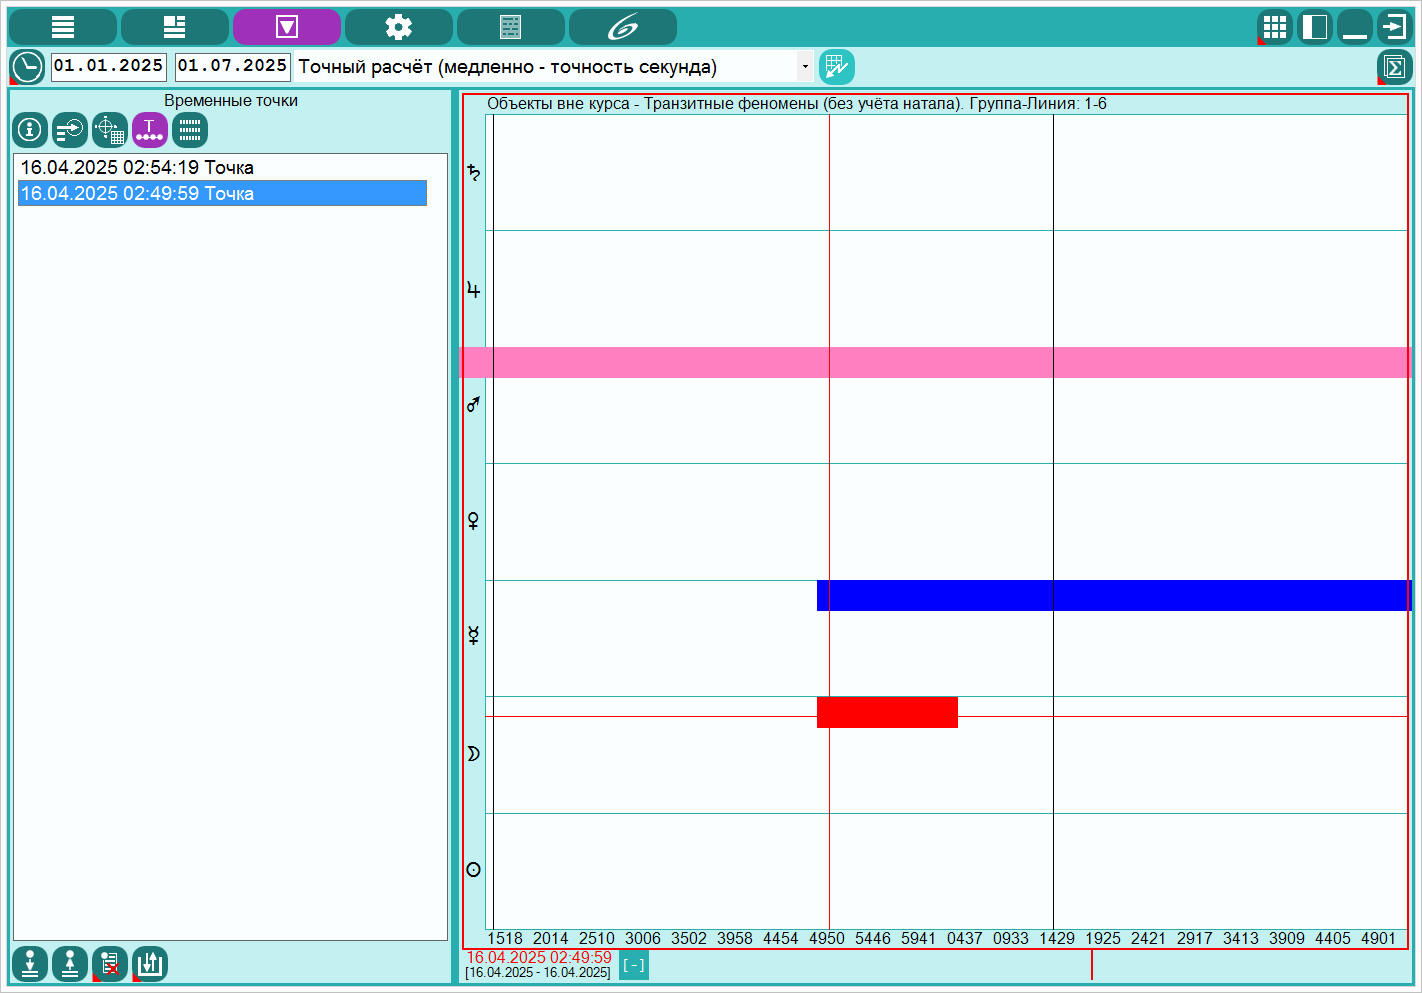
Data analysis. Search mode is the position of objects. Temporary points. From this screen you can create, restore, save, load and display the temporary points created by the user during operation. The mechanism of time points allows you to quickly return to the desired date-time, which were preserved during operation. In addition, saved temporary points can be transferred to another program for the subsequent analysis of phenomena. |
Data analysis. Search mode - direction of movement of objects
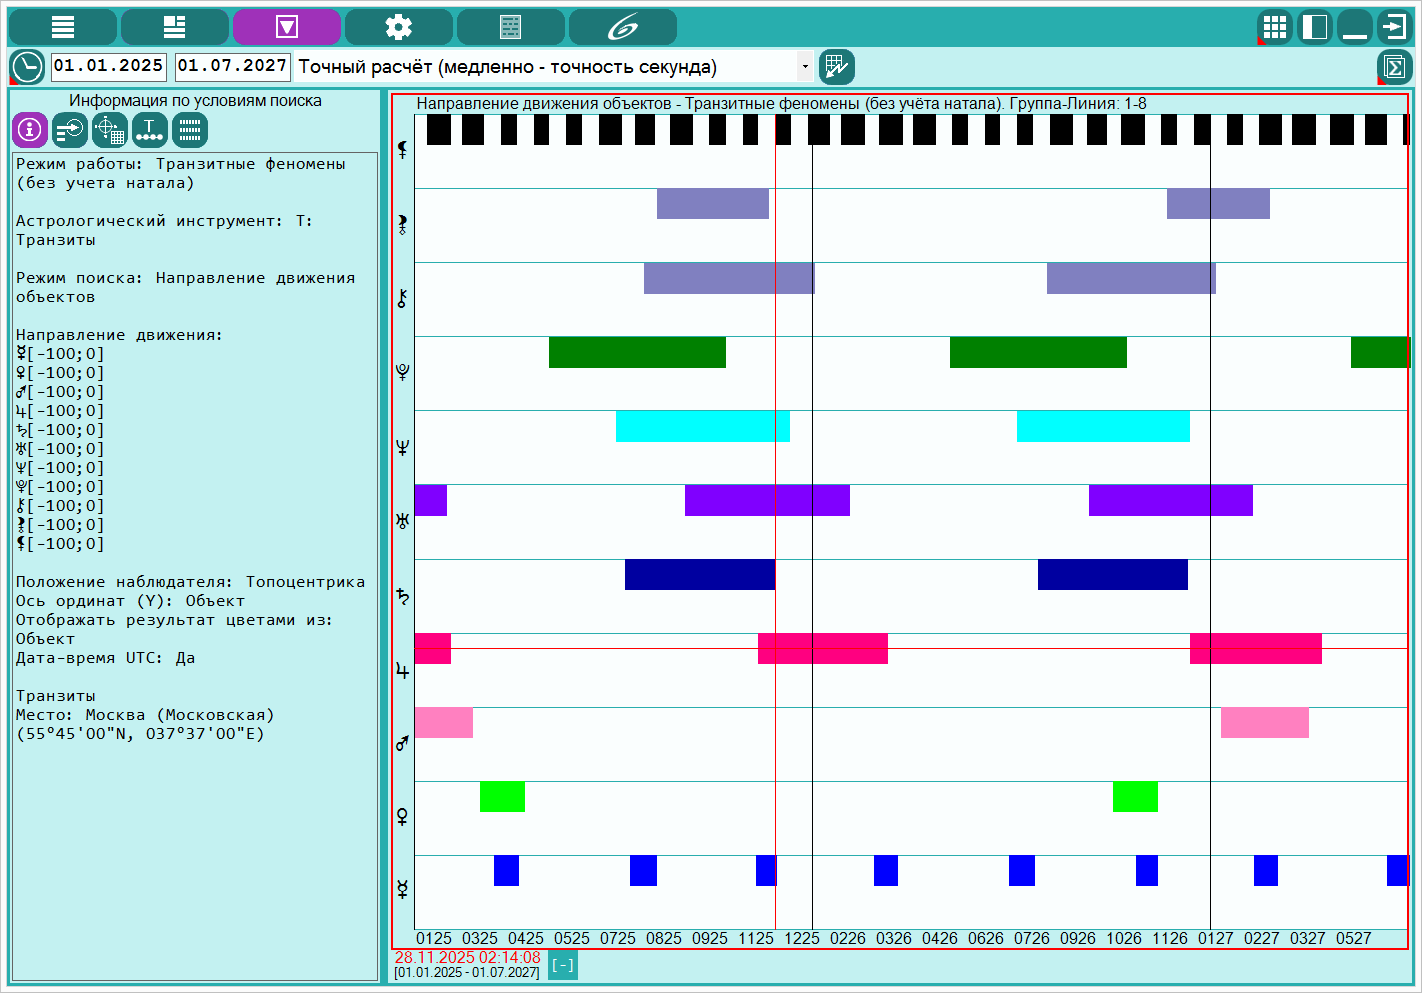 |
Data analysis. Search mode - direction of movement of objects. Information on the search conditions. The search for periods of finding objects in:
|
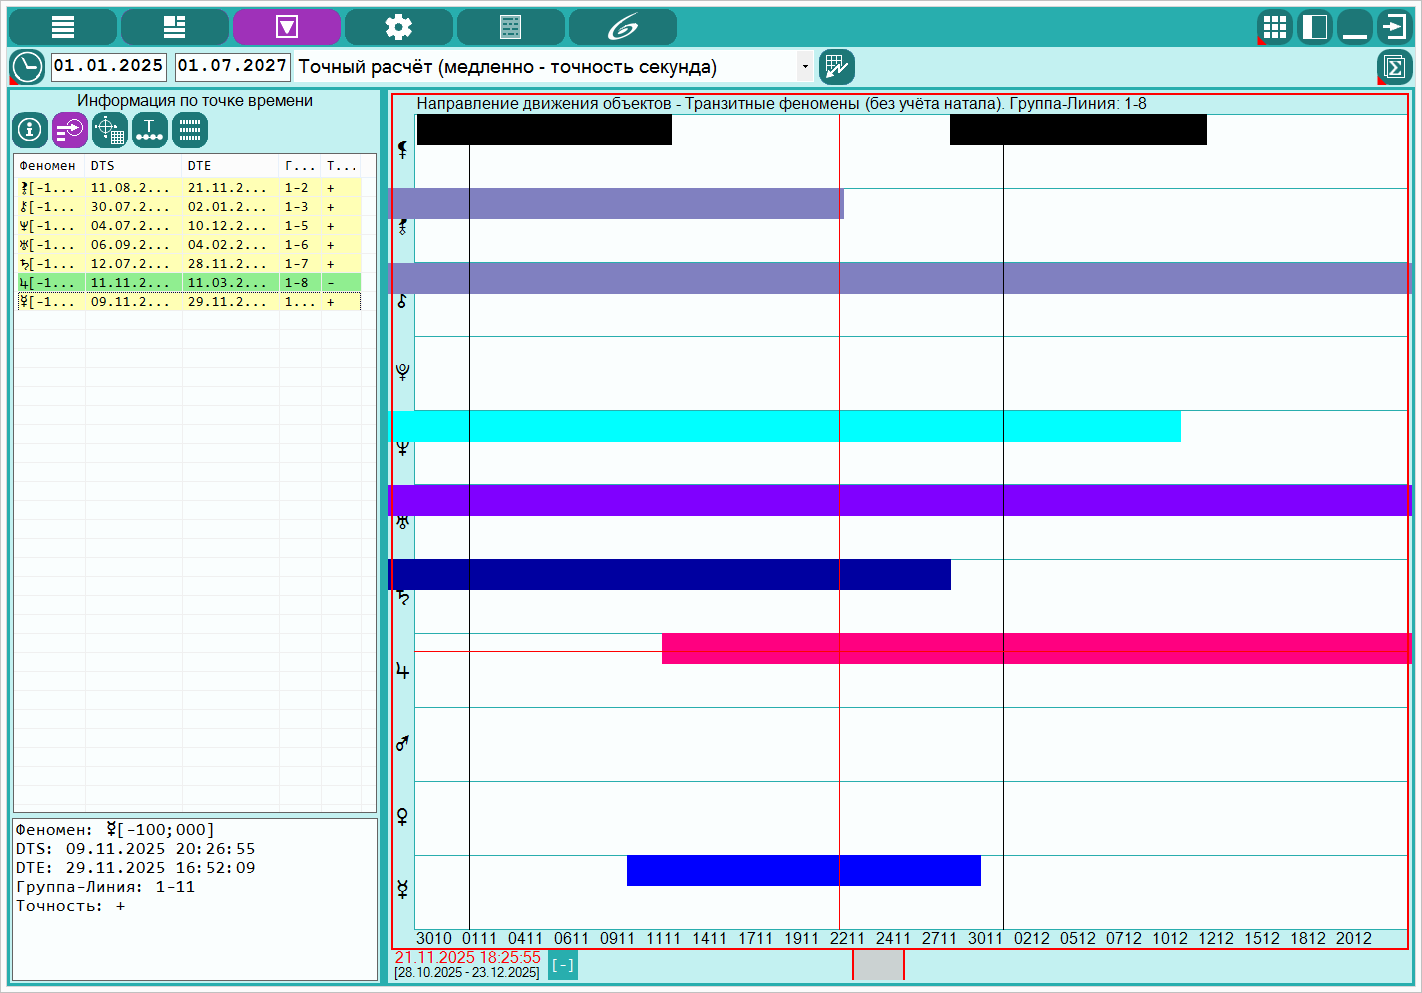 |
Data analysis. Search mode - direction of movement of objects. Information on the point of time. Depending on the search mode, from this screen you can see accurate representations of the date-time of the search results of a phenomenon selected on the screen in the group and the line with the left mouse button. Those when clicking the left mouse button on the screen, the cursor will be displayed in the form of a vertical and horizontal line. And if the result of the search (phenomenon) is displayed at the place of intersection of the cursor lines, then the exact periods of the specified phenomenon will be displayed in the list to the left of the groups. Since the vertical line (cursor of the date-time) - crosses all groups and lines, then all phenomena will be displayed on the list on the indicated date and time. But depending on whether they are included in the same group and whether the horizontal line falls on the phenomenon, the recordings in the list will be displayed by different colors:
|
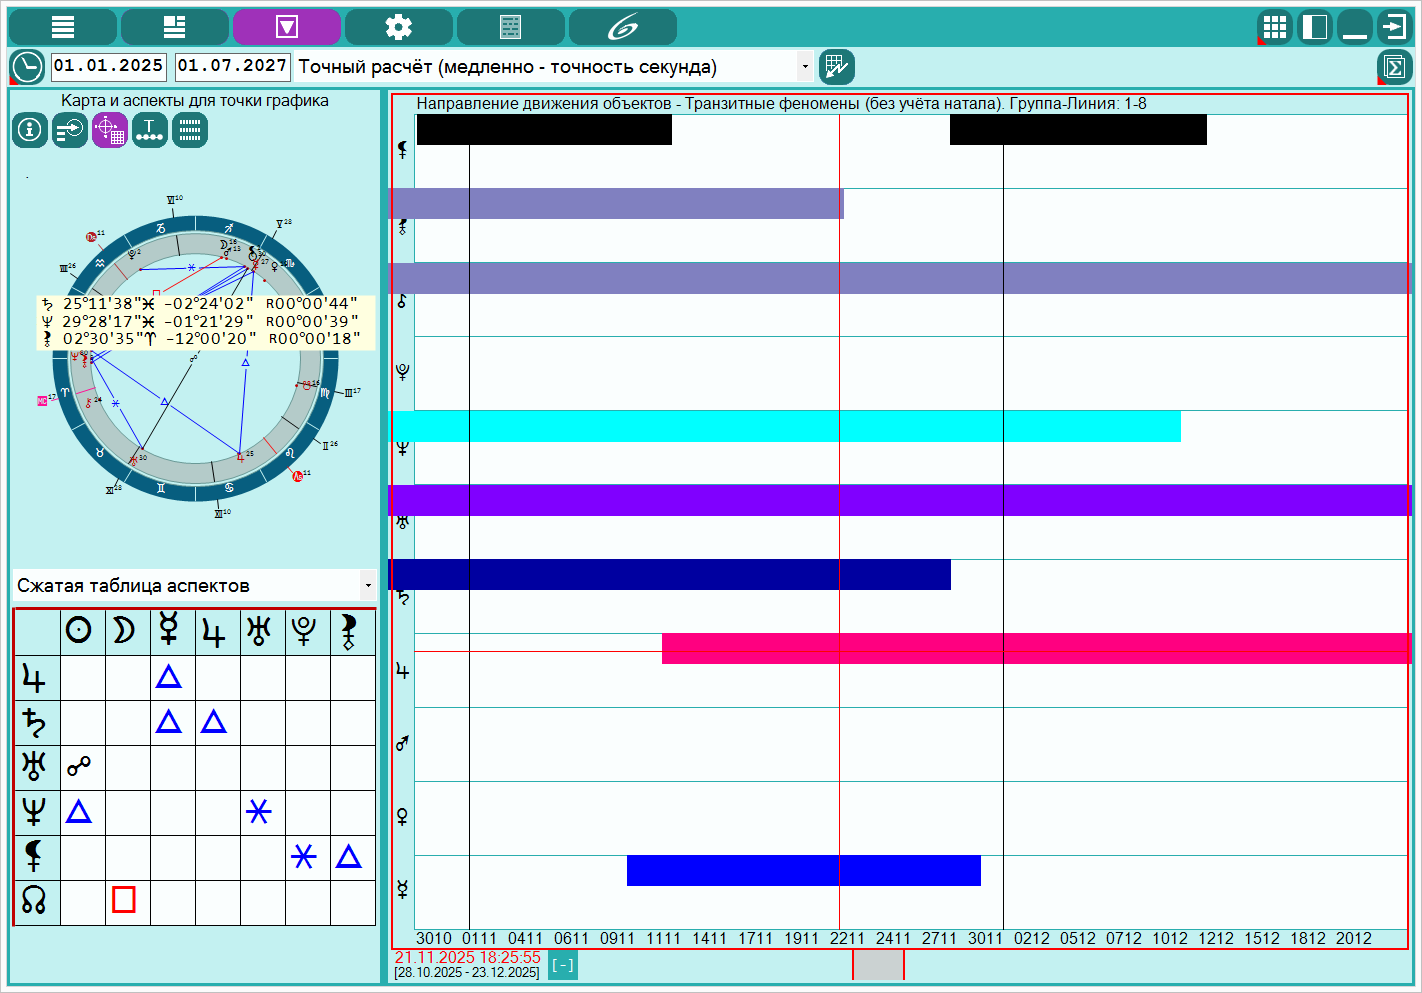 |
Data analysis. Search mode - direction of movement of objects. Chart and aspects for the schedule. On this screen you can see the chart and its aspects for the date of the date-time under the cursor. Those by clicking the left mouse button on the screen with the search results, we set the date of the date-time under the cursor and we see the chart for this temporary point. Depending on the mode of operation, it may be displayed:
|
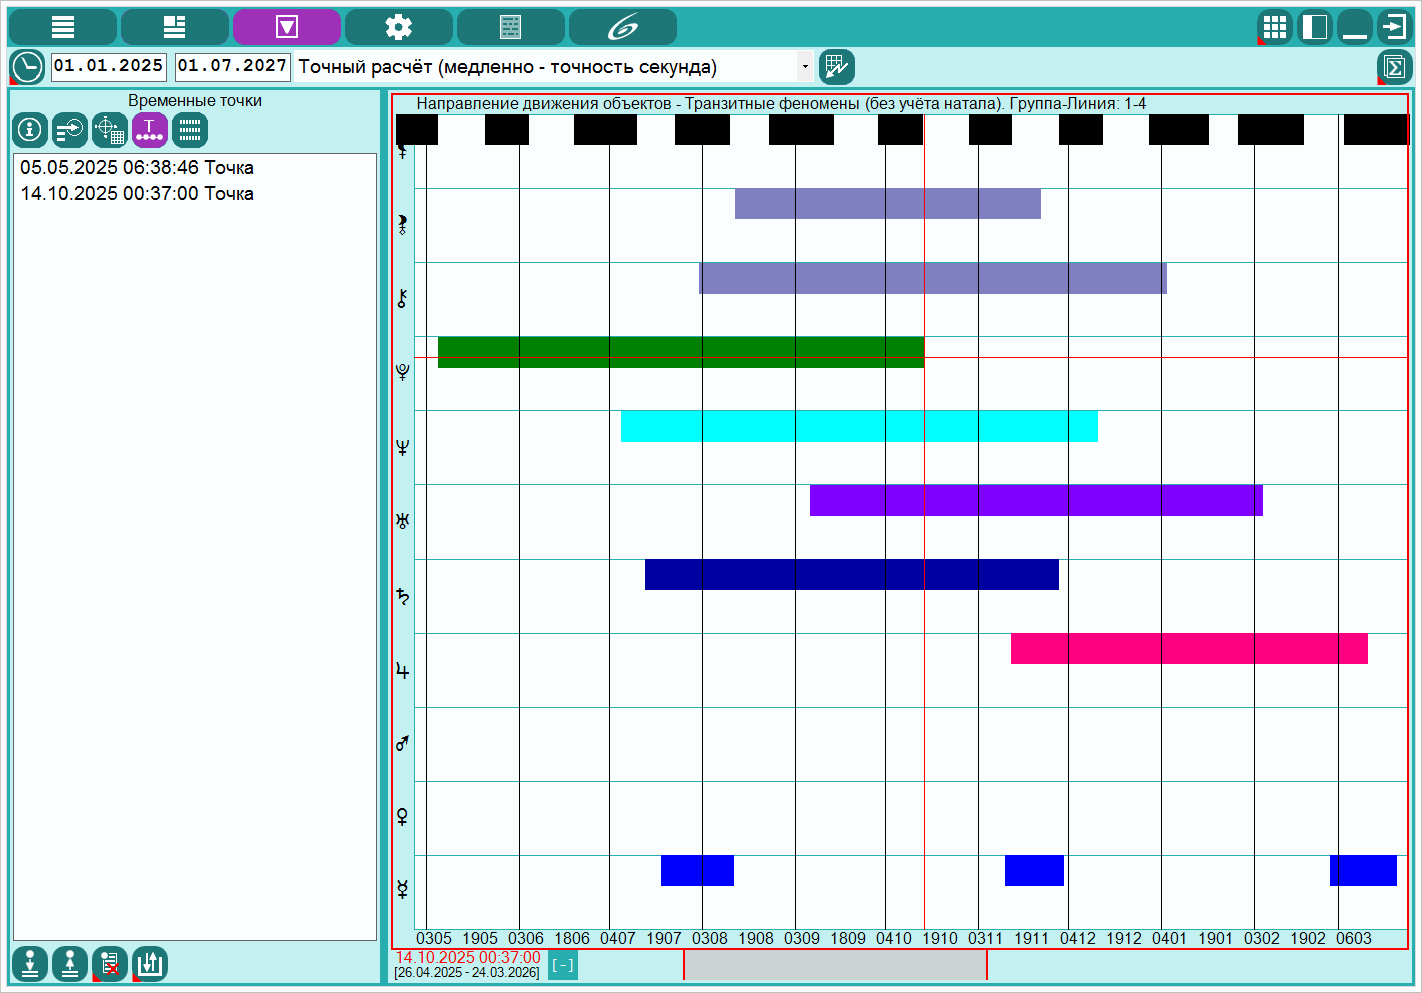 |
Data analysis. Search mode - direction of movement of objects. Temporary points. From this screen you can create, restore, save, load and display the temporary points created by the user during operation. The mechanism of time points allows you to quickly return to the desired date-time, which were preserved during operation. In addition, saved temporary points can be transferred to another program for the subsequent analysis of phenomena. |
Data analysis. Search mode - objects without the course
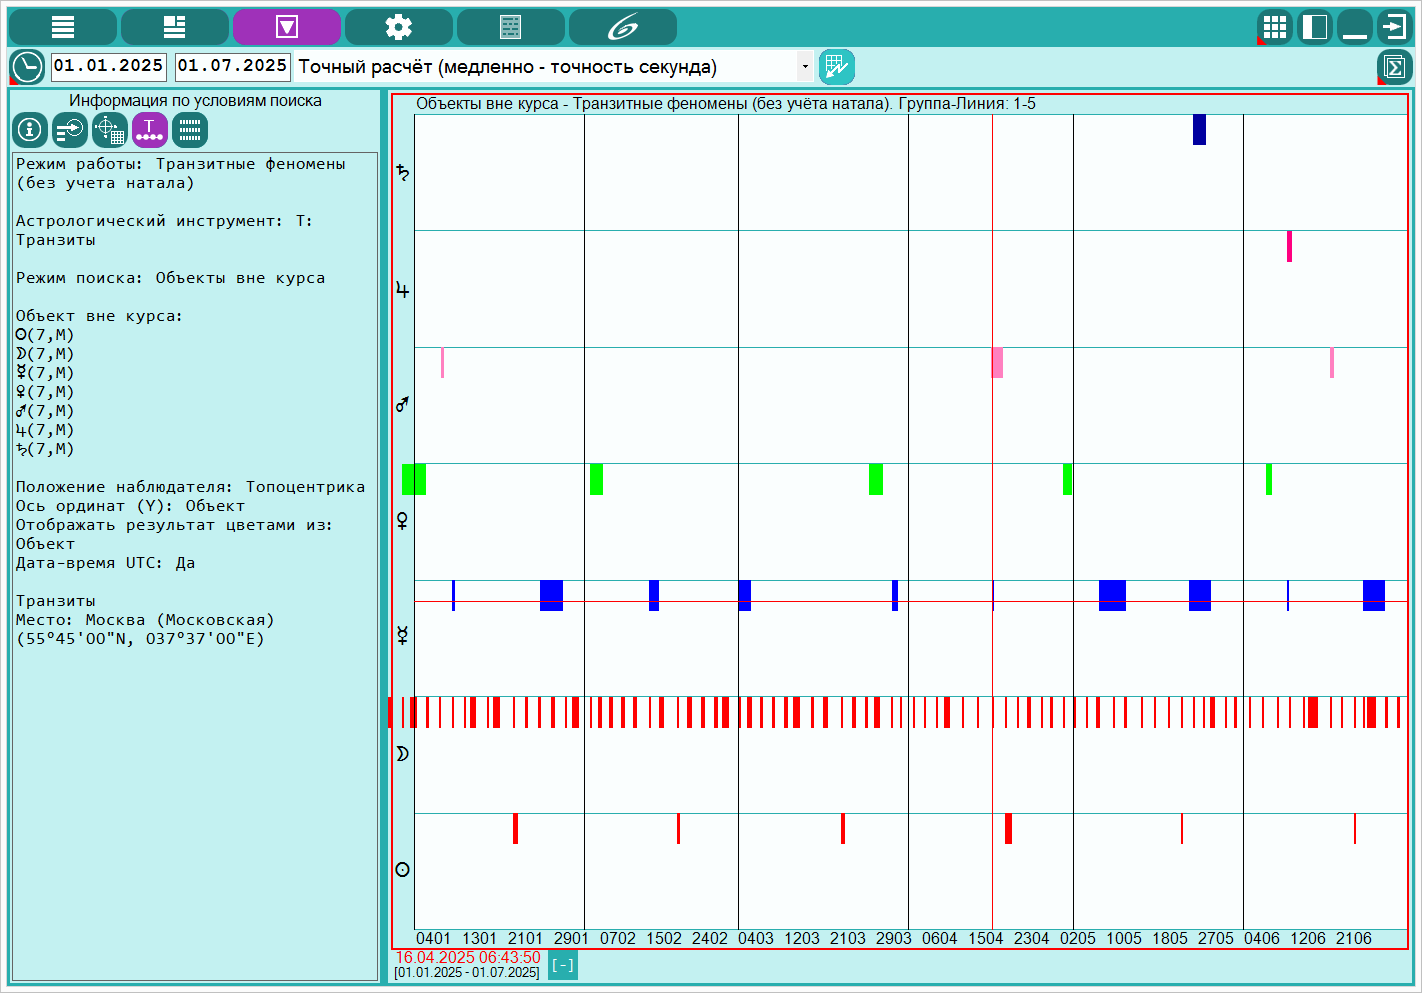 |
Data analysis. Search mode - objects without the course. Information on the search conditions. Important! This search mode is available only in `transit phenomena mode - transit chart objects`! The search for periods of finding the object without the course, taking into account:
|
 |
Data analysis. Search mode - objects without the course. Information on the point of time. Depending on the search mode, from this screen you can see accurate representations of the date-time of the search results of a phenomenon selected on the screen in the group and the line with the left mouse button. Those when clicking the left mouse button on the screen, the cursor will be displayed in the form of a vertical and horizontal line. And if the result of the search (phenomenon) is displayed at the place of intersection of the cursor lines, then the exact periods of the specified phenomenon will be displayed in the list to the left of the groups. Since the vertical line (cursor of the date-time) - crosses all groups and lines, then all phenomena will be displayed on the list on the indicated date and time. But depending on whether they are included in the same group and whether the horizontal line falls on the phenomenon, the recordings in the list will be displayed by different colors:
|
 |
Data analysis. Search mode - objects without the course. Chart and aspects for the schedule. On this screen you can see the chart and its aspects for the date of the date-time under the cursor. Those. By clicking the left mouse button on the screen with the search results, we set the date of the date-time under the cursor and we see the map for this temporary point. Depending on the mode of operation, it may be displayed:
|
 |
Data analysis. Search mode - objects without the course. Temporary points. From this screen you can create, restore, save, load and display the temporary points created by the user during operation. The mechanism of time points allows you to quickly return to the desired date-time, which were preserved during operation. In addition, saved temporary points can be transferred to another program for the subsequent analysis of phenomena. |
Examples and reports
 |
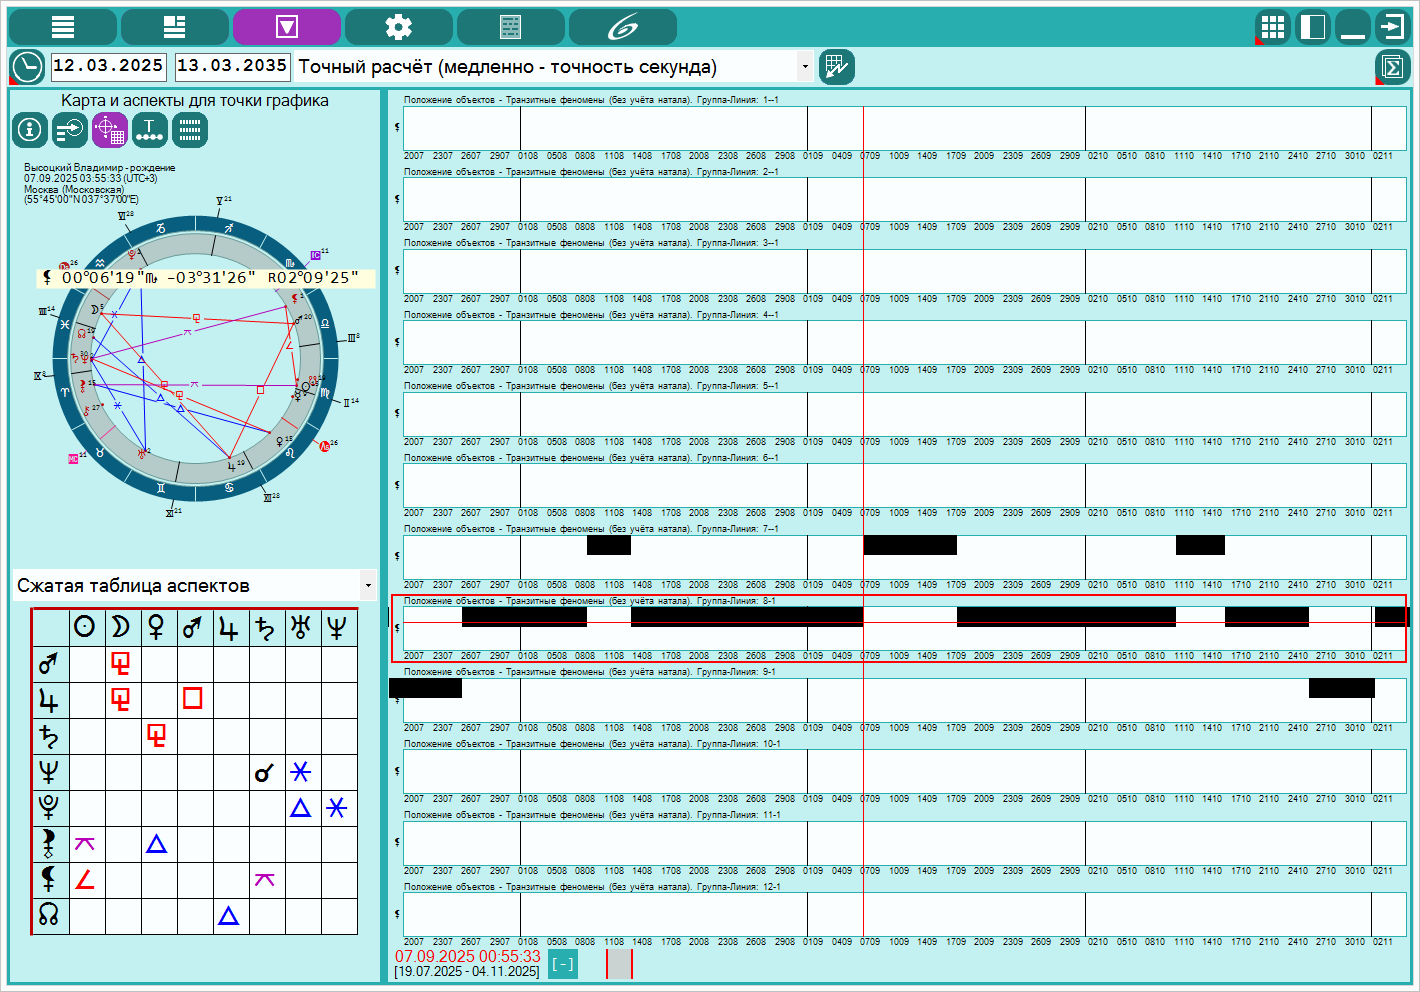
Data analysis. Example of position of Lilith. An example of the position of the true Black Moon is Lilith in the signs of the zodiac. |
 |
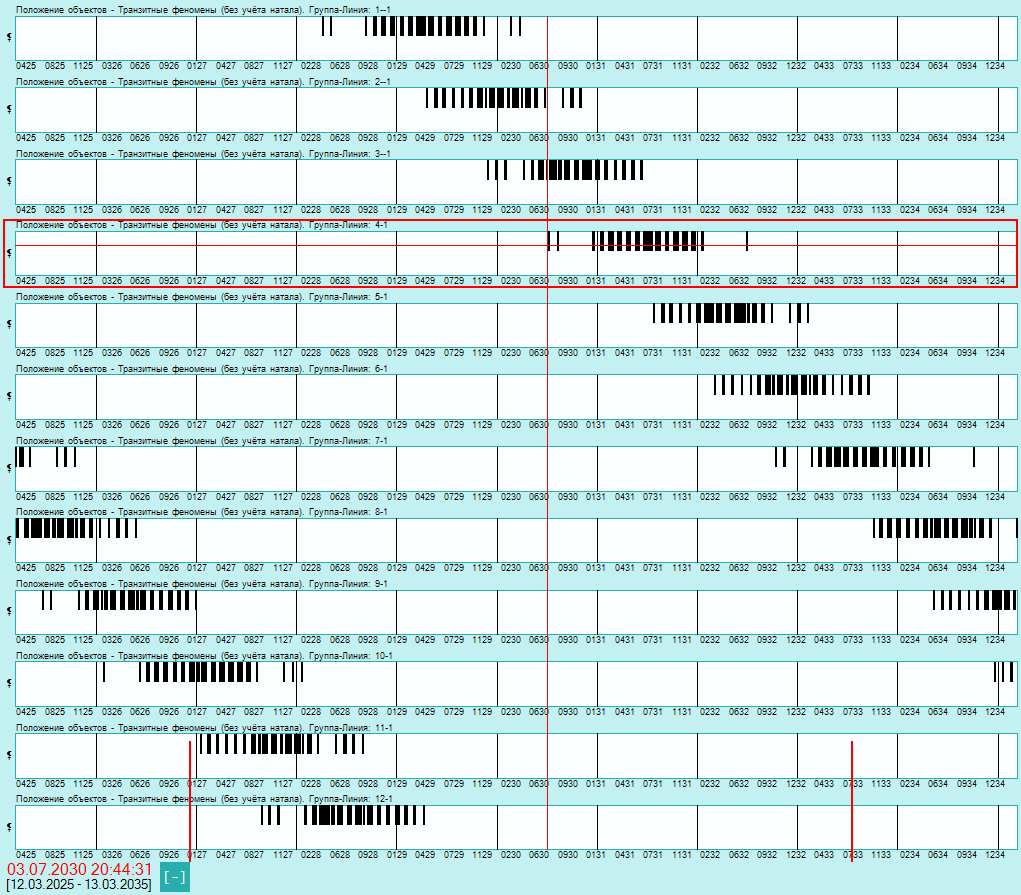
Data analysis. Example of scaling of period for position of Lilith. An example of the scaling of the period for the position of the true Black Moon is Lilith in the signs of the zodiac. |
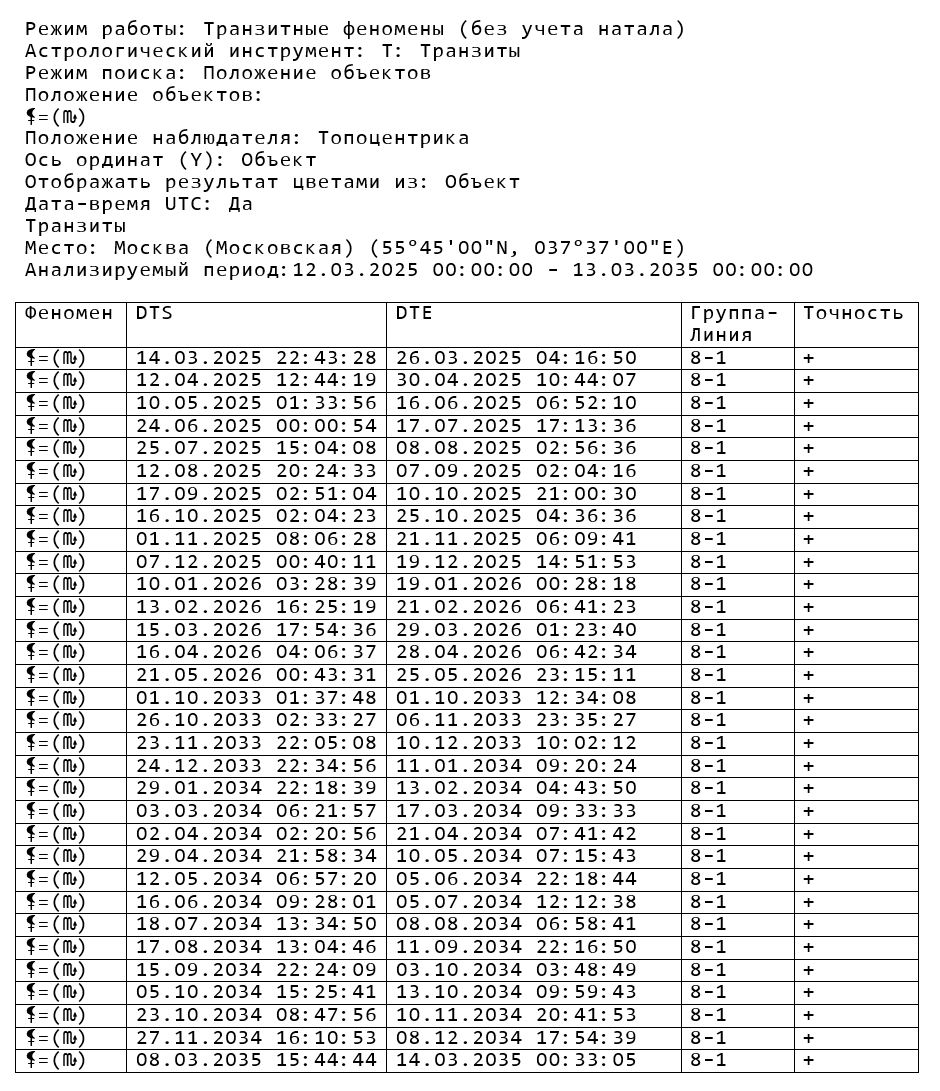 |
Reports of work results. Document report in RTF format. The document contains:
|
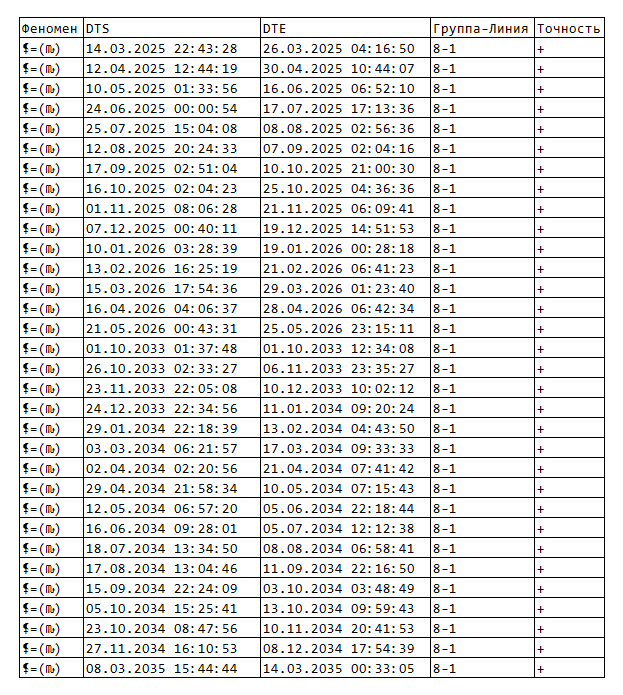 |
Reports of work results. Report of the spreadsheet in XLS format. It is similar to the report in RTF format, except that the spreadsheet does not have a description of the source data. |
 |
Reports of work results. A picture of all groups. Allows you to photograph the entire screen with the results of the work (all groups). If the multimode module is not available, then this item turns into the previous one, with one group, since you can get the results with several groups only if there is a multimode module. |
Download resources according to the astrological program
- Aspectarium short promotional video
- Video-instruction on work with Aspectarium. Part 1 - Operating modes, search modes and data entry.
- Video-instruction on work with Aspectarium. Part 2 - Search for phenomena.
- Video-instruction on work with Aspectarium. Part 3 - Multimode.
- Video-instruction on work with Aspectarium. Part 4. Practical part. Search for thematic aspects for a given topic of the house.
- Galaxy programs - new features. Update (20250927).
- Galaxy programs - new features. Update (20260429).
- Video lessons on working with program elements
- First steps with Galaxy
- Learning Galaxy. Video lessons
- How I do it. Practical astrology lessons with Galaxy
- Videos on Galaxy astrology programs on the Internet
- MedicalPoint Help File
- Other site resources

